Bitcoin Price Analysis: Here’s Why BTC Jumped by 5% Today
Bitcoin has recently experienced an uptick in demand near the crucial support region of the 100-day moving average, leading to a notable rebound.
This price action underscores a bullish sentiment in the market with the potential for a continued rally toward a new all-time high.
Technical Analysis
By Shayan
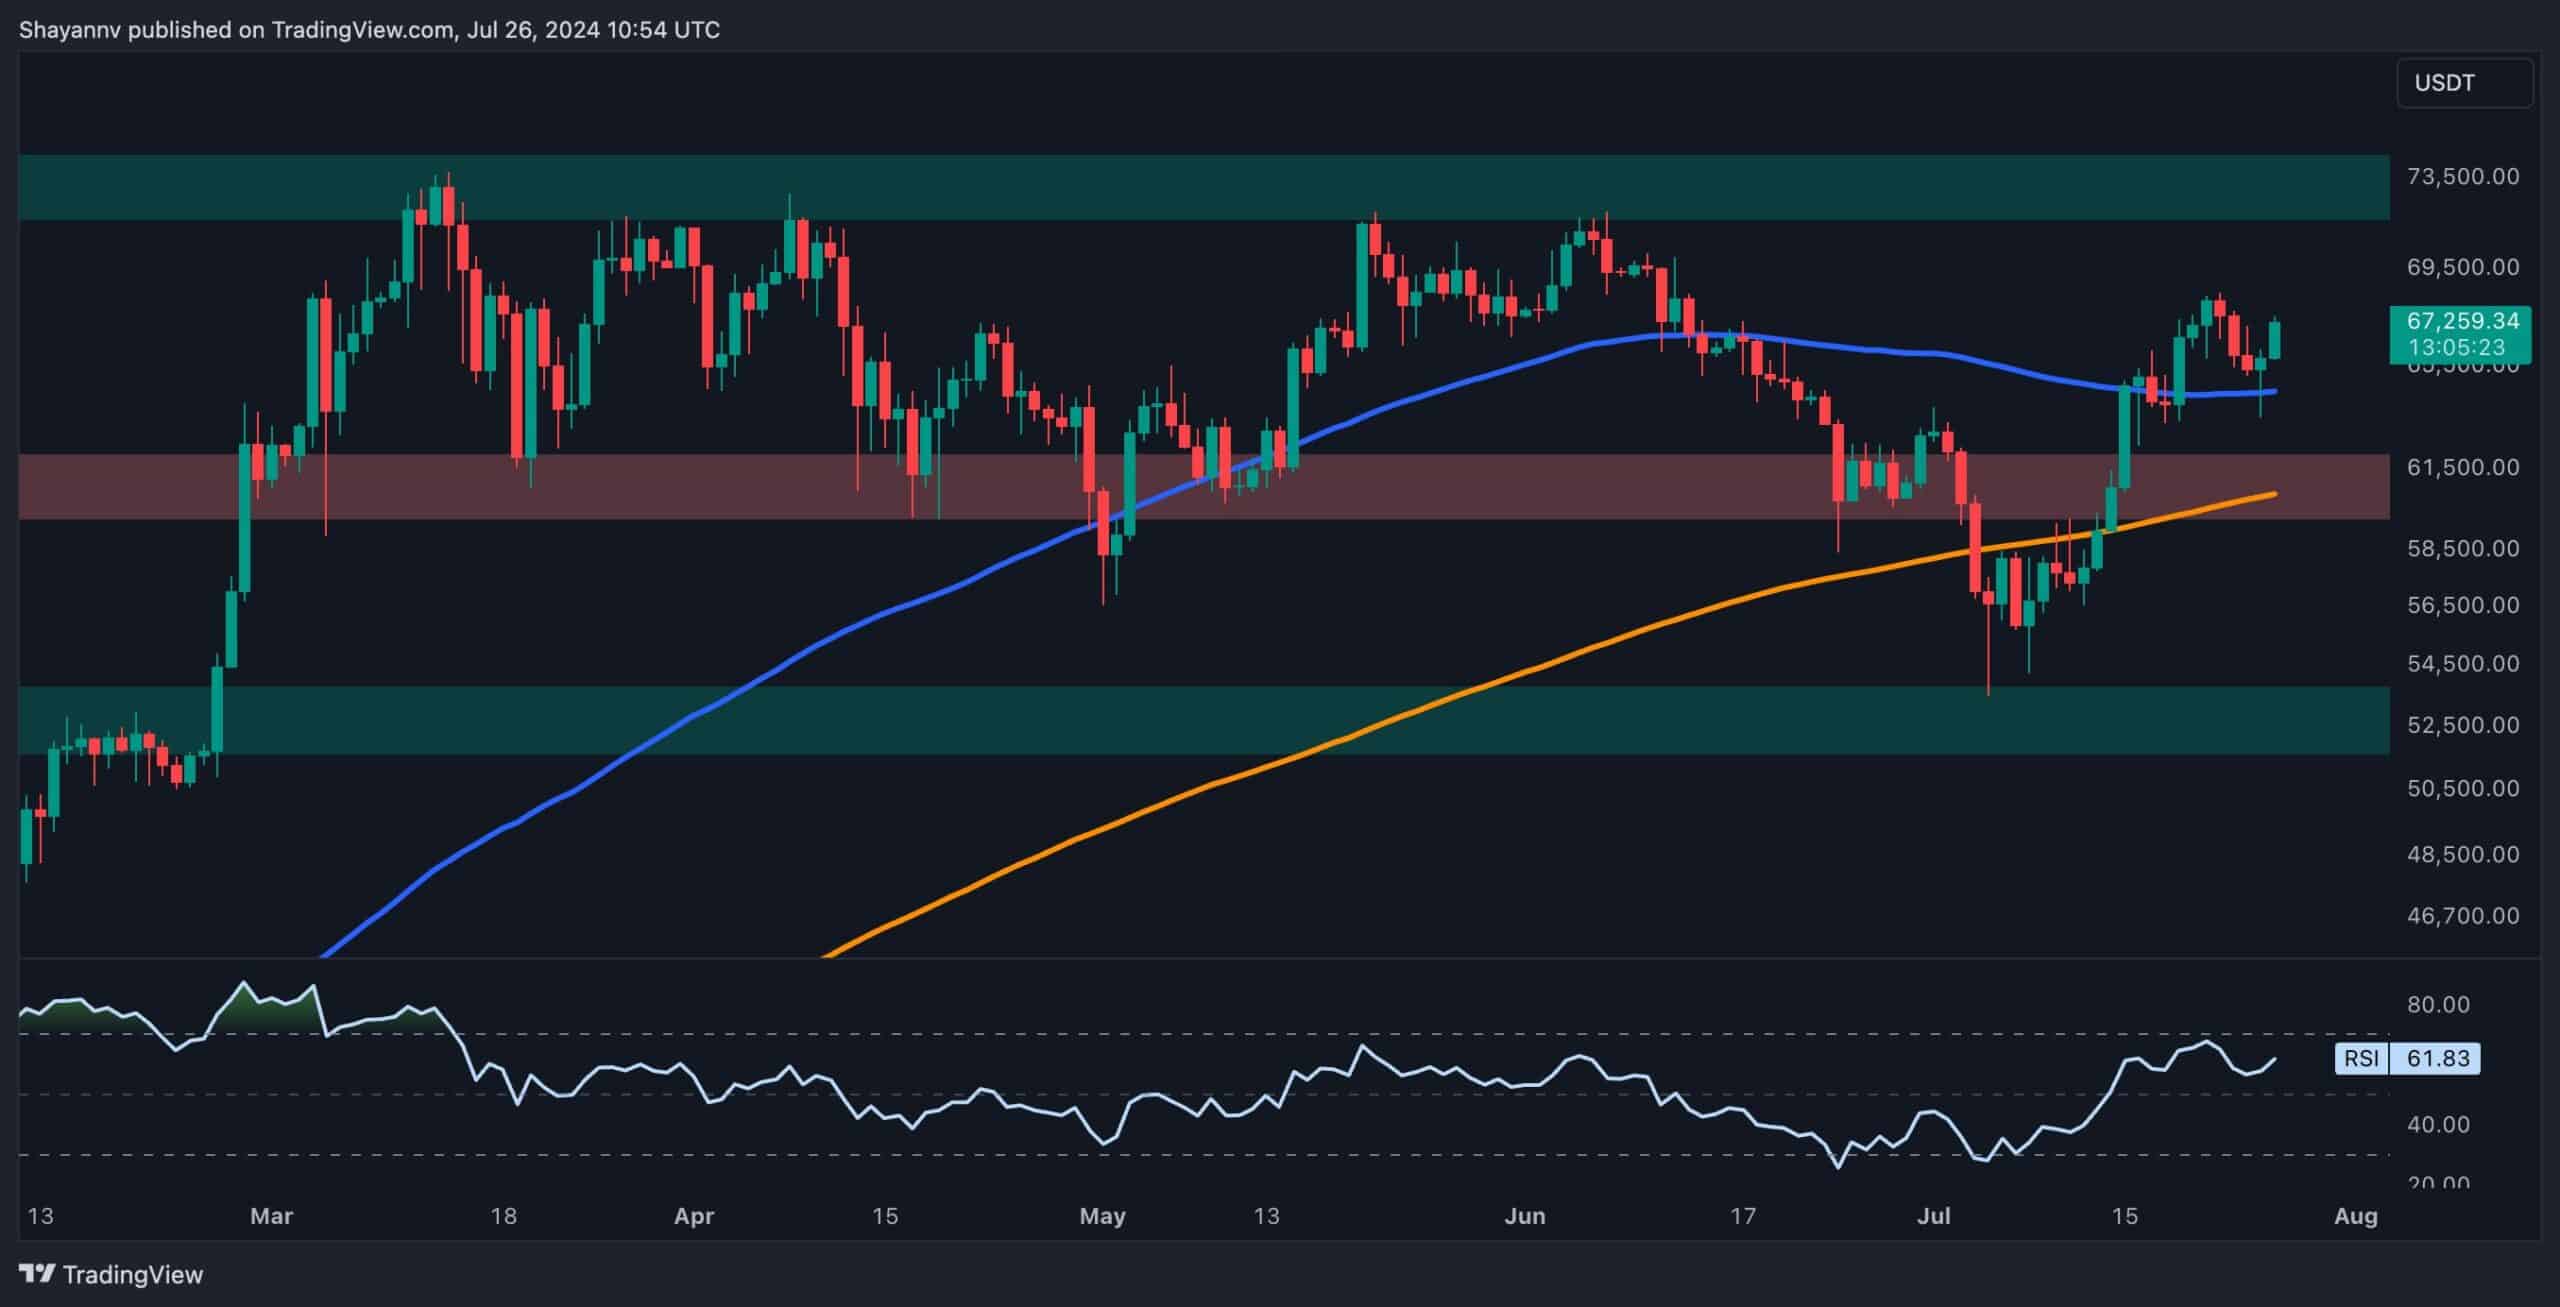
The Daily Chart
A detailed analysis of Bitcoin’s daily chart reveals that following a resurgence of demand near the critical $53K support area, the cryptocurrency initiated an impulsive bullish rally, surpassing several key resistance levels and introducing a bullish sentiment into the market.
These zones include the 200-day moving average at $60.5K, the 100-day moving average at $64.4K, and the static resistance at $61K. After breaking above the 100-day MA, the price recently exhibited a corrective retracement, completing a pullback to the broken level and validating the breakout.
Currently, Bitcoin has faced heightened buying pressure near the 100-day MA and experienced a bullish rebound toward the $67K threshold. If conditions remain stable, there is potential for the bullish trend toward the significant resistance region of $70K in the mid-term to continue.

The 4-Hour Chart
On the 4-hour chart, after receiving sufficient support near the lower boundary of the multi-month wedge at $54K, the price initiated an impulsive bullish rally, reaching the wedge’s upper trendline at $68K.
This price action clearly indicates that buyers are eager to push above the $70K resistance and set a new ATH for Bitcoin in the mid-term. During the recent rally, the price has formed an ascending short-term trendline, serving as the main support for BTC in the short term.
However, Bitcoin faced increased selling pressure near the wedge’s upper boundary, leading to a notable rejection toward the upslope trendline and the $64K support region.
Yet, the cryptocurrency was supported by the trendline and the $64K threshold, initiating a new surge toward the wedge’s upper boundary. Currently, the price is confined by the dynamic support of the ascending trendline and the dynamic resistance of the wedge’s upper boundary, roughly forming a triangle pattern.
A break above the wedge’s upper trendline will pave the way for a renewed bullish surge toward the $70K threshold. Conversely, a break below the ascending trendline could lead to a retracement toward the $64K mark.

On-chain Analysis
By Shayan
While Bitcoin’s price has experienced a notable bullish reversal, a closer examination is essential to determine if this trend will persist.
The Taker Buy/Sell Ratio, a crucial metric for evaluating futures market sentiment, provides valuable insights into the market dynamics. Values above 1 indicate aggressive buying by bulls, while values below 1 suggest bearish selling pressure.
The chart highlights the Taker Buy/Sell Ratio, which has experienced an impulsive surge above the “1” threshold concurrently with Bitcoin’s bullish revival. This surge signifies strong buying interest in the perpetual market, indicating a notable bullish sentiment and significant buying activity. If the upward trend in the Taker Buy/Sell Ratio continues, it confirms a potential mid-term bullish trend, with the price likely rallying toward the $70K mark.

The post Bitcoin Price Analysis: Here’s Why BTC Jumped by 5% Today appeared first on CryptoPotato.