Top 5 Cryptocurrencies Regain Momentum As Bitcoin Hits $68K, What’s Next?

The post Top 5 Cryptocurrencies Regain Momentum As Bitcoin Hits $68K, What’s Next? appeared first on Coinpedia Fintech News
With the ongoing Bitcoin Conference 2024, the market leader, BTC price has successfully reclaimed the $68K market with a market capitalization of $1.34 Trillion and a dominance of 55.4%.
Resulting to this, top altcoins have recorded a significant rise in their sentiments, highlighting increased buying and selling pressure in the crypto space.
With the rising volatility in the market, will the top five cryptocurrencies break out of their important resistance level and record a new all-time high (ATH) during the upcoming crypto bull run?
Bitcoin (BTC) Price Action:
With a jump of 1.26% within the past 24 hours and a trading volume of $24.125 Billion and 2.46% over the past week, the market leader, Bitcoin price has successfully retested its support trendline of the ascending channel pattern. Further, with a jump of over 11% within the past 30 days, the star crypto has recorded increased bullish sentiment.
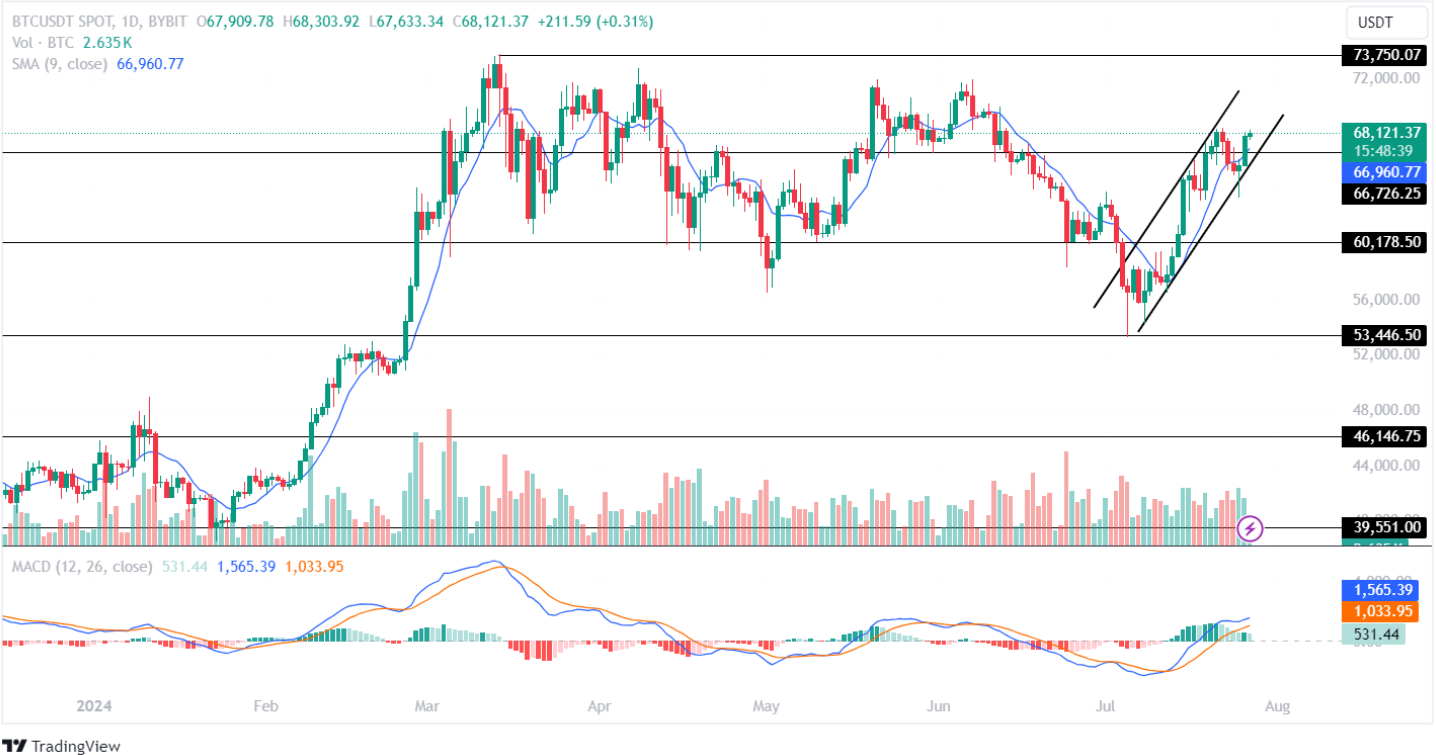
The Simple Moving Average (SMA) constantly acts as a support to the price chart in the 1D time frame. However, the MACD indicator has displayed a constant decline in the green histogram with its averages displaying a neutral trend. This highlights uncertainty in future price action.
If the market continues to trade under a bullish sentiment, the BTC price will prepare to test its ATH of $73,750.07 during the upcoming weeks. Conversely, a bearish reversal could result in the Bitcoin price plunging toward its support trendline of the channel pattern.
Ethereum (ETH) Price Analysis:
Despite recording a jump of 1.05% over the past 24 hours, the Ethereum price has lost 6.22% over the past week. Furthermore, the altcoin leader, ETH price has dropped 3.85% over the past 30 days, highlighting a strong bearish sentiment for it in the crypto space.
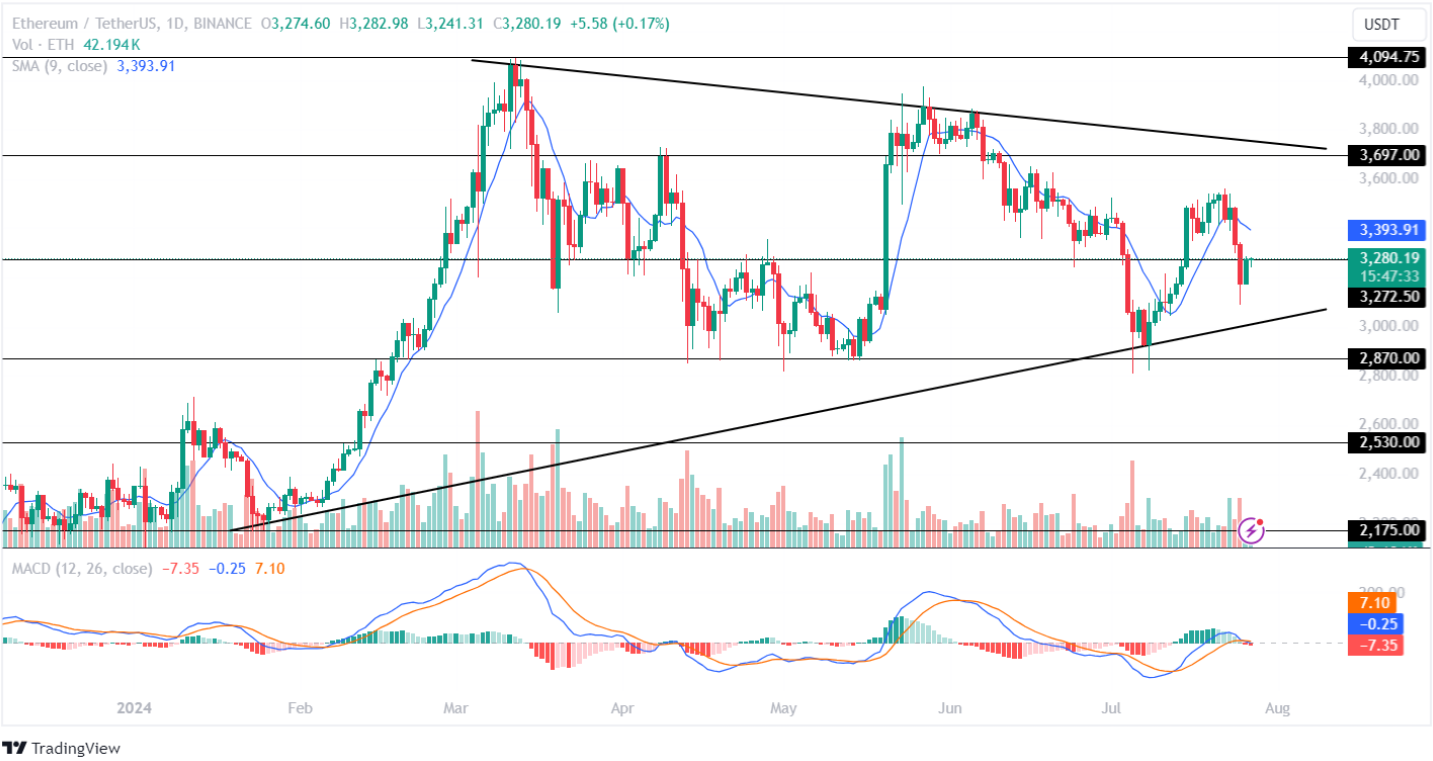
The Moving Average Convergence Divergence (MACD) has constantly risen in the red histogram, indicating increased selling pressure within the crypto space. Furthermore, the averages have recorded a bearish convergence, suggesting a negative outlook for the altcoin leader in the coming time.
If the market holds the price above its important support level of $3,272, the ETH price will head toward its upper resistance level of $3,700. However, if the bears overpowered the bulls, the Ethereum price will retest its crucial support level.
Solana (SOL) Price Action:
The SOL coin price continues to display a bullish action, adding approximately 10% within the past seven days. Moreover, with a YTD surge of 82.27%, the Solana price has successfully surpassed the Binance coin price to become the 4th largest crypto token with an MC of $86.18 Billion.
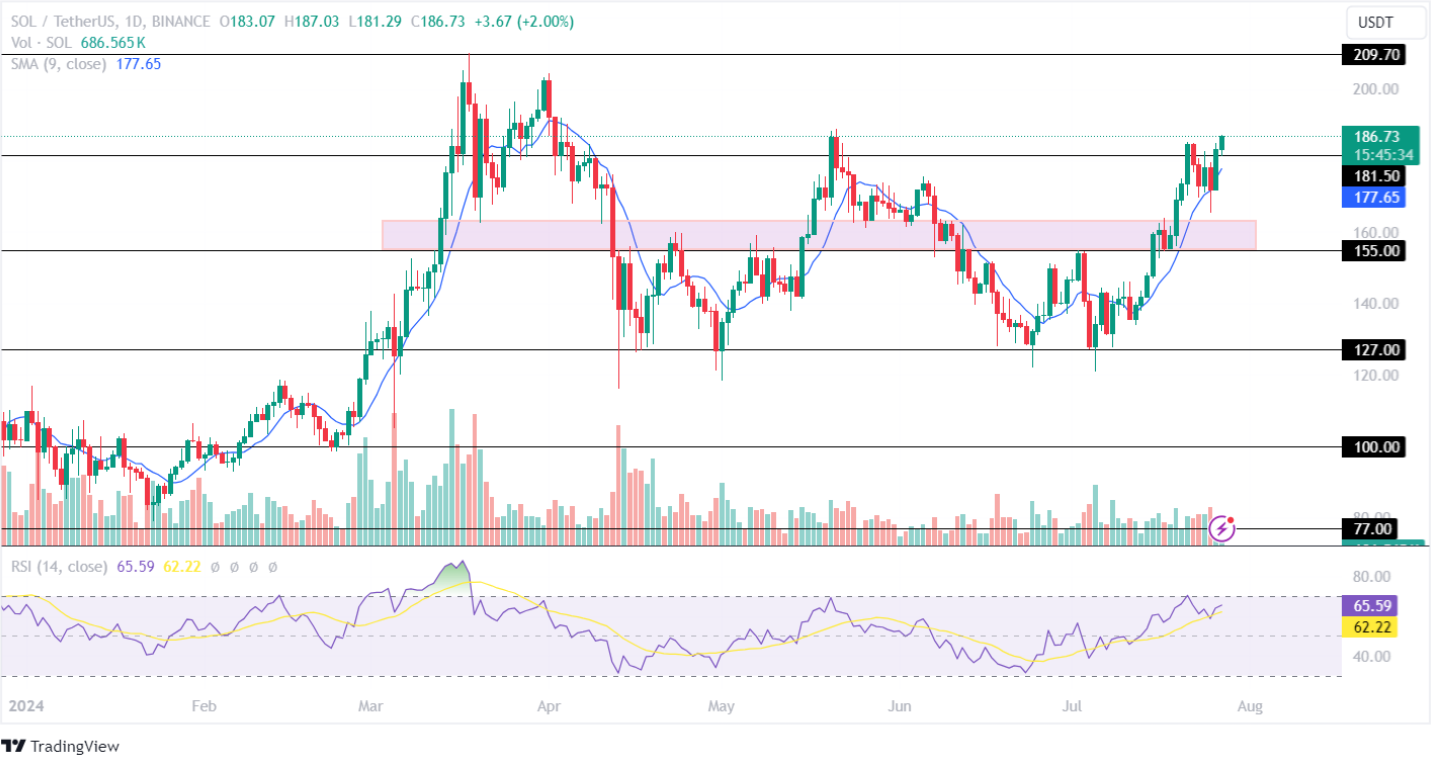
The technical indicator, RSI, has displayed a bullish convergence in the 1D time frame and is constantly headed toward its overbought range. This indicates an increase in the buying-over-selling pressure for the Solana price in the cryptocurrency market.
Maintaining the price above its support level of $181.50 will set the stage for the SOL price to attempt to test its yearly high of $209.70. Negatively, a bearish trend reversal could result in the Solana price dropping toward its low of $155 in the coming time.
Binance (BNB) Price Analysis:
Amid increased price volatility, the BNB price has jumped 2.26% over the past 24 hours with a trading volume of $1.598 Billion, a change of -11.90%. Despite recording a correction of approximately 1% within the past week, the Binance price has surged 88.13% this year, indicating a positive outlook.
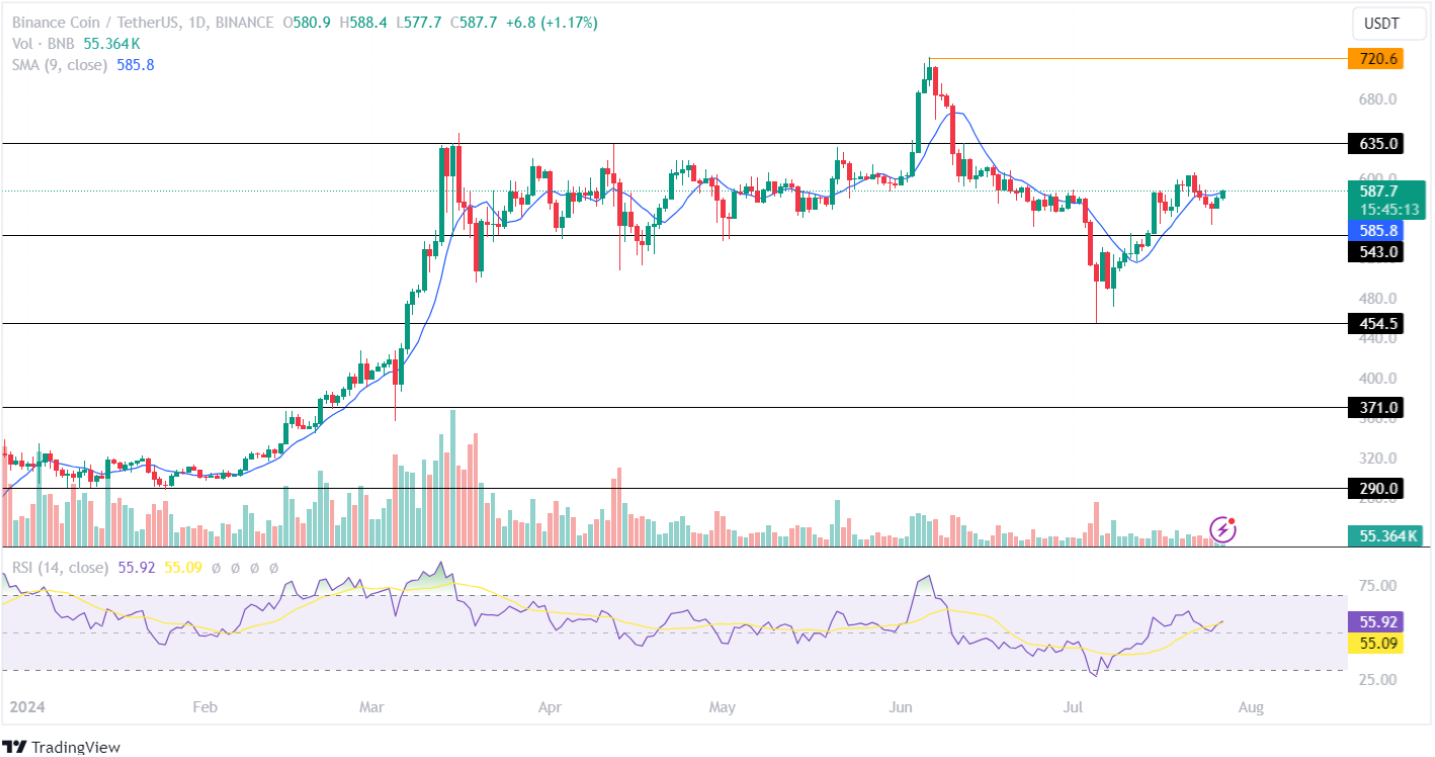
The Relative Strength Index (RSI) has retested its mid-point in the 1D time frame, indicating a strong bullish recovery in the crypto space. On the other hand, the average has recorded a positive crossover, suggesting that the Binance price will continue gaining value in the coming time.
Suppose, the bulls continue to gain momentum, in that case, the BNB crypto will test its resistance level of $635. Conversely, if the market loses momentum, the Binance token will retest its important support level of $543.
Ripple (XRP) Price Action:
After recording a bearish action for over two months, the Ripple price has regained momentum and has added approximately 1% within the past day with a trading volume of -44.49%. Further, it has jumped 1.42% within the past seven days and 27.12% over the past 30 days.
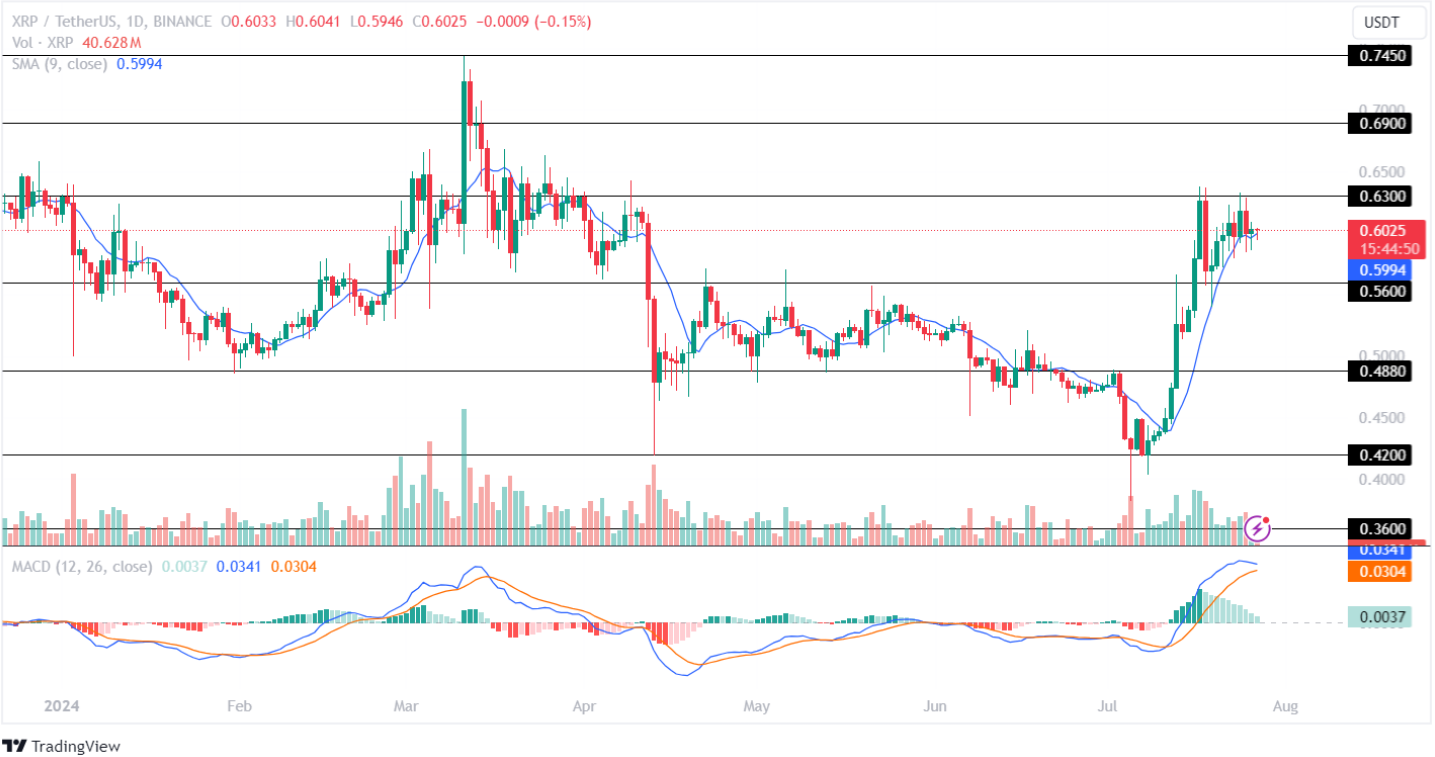
The MACD indicator has displayed a constant decline in the green histogram, indicating a weak price action for the XRP token in the market. Further, the averages show a high possibility of a bearish crossover, suggesting a negative outlook for the altcoin in the coming time.
If the bulls regain momentum, the XRP price will surpass its resistance level of $0.63 and head toward its high of $0.69. However, if the market turns bearish, the Ripple crypto will plunge toward its support level of $0.560.