Trump’s $35 Trillion Debt Plan: Analysing The Impact on Cryptos


The post Trump’s $35 Trillion Debt Plan: Analysing The Impact on Cryptos appeared first on Coinpedia Fintech News
Donald Trump recently suggested that the United States could use Bitcoin to pay off the country’s national debt. The idea triggered serious debates, especially inside the crypto community. Could Bitcoin really help tackle the national debt? More importantly, what would this mean for the crypto industry, how might BTC’s price react? Let’s dive into these questions deeper!
US Debt Crisis: An Overview
As per the official data published by the US government, the national debt of the United States, or the amount of outstanding borrowing the government accumulated over the nation’s history, is nearly $35.05 trillion, as of 6th August, 2024.
The below data shows the growth of the US National Debt over the last 100 years.
| Year | U.S. National Debt |
| 1923 | $403 B |
| 1943 | $2.40 T |
| 1963 | $3.07 T |
| 1983 | $4.20 T |
| 2003 | $11.24 T |
| 2013 | $21.93 T |
| 2023 | $33. 17T |
In 1923, almost 100 years ago, the US national debt was just $403 B. Between 1923 and 1943, the growth of the depth was comparatively slower. In 1943, the debt was a little more than $2.40 T. In 1963 and 1983, the values were $3.07 T and $4.20T. Between 1943 and 1983, the depth growth was majorly stagnant. Post 1983, it was a period of sharp rise. In 2003, the debt reached as high as $11.24 T. In 2013, it nearly doubled to $21.93 T. In 2023, it reached a shocking high of $33.17 T. Now, it stands at $35.05 trillion.
What reveals a country’s ability to pay down the country’s debt to its GDP ratio. Shocking is the US’ debt to its GDP ratio. It now stands far above one hundred per cent. In fact, it surpassed the mark of 100% as early as 2013 itself. In 2023, it was 123%.
Here is the US’ debt to its GDP ratio:
| Year | US Debt to GDP |
| 1948 | 96% |
| 1958 | 58% |
| 1974 | 32% |
| 1996 | 66% |
| 2001 | 55% |
| 2020 | 127% |
| 2023 | 123% |
In 1948, the ratio was around 96%. But it fell to 58% in 1958, and further to 32% in 1974. In 1996, it reached 66%. Later, in 2001, it cooled down to 55%. Later, it saw a period of sharp rise. In 2020, it touched a peak of 127%. In 2023, it slightly came down to 123%.
The data indicates that the biggest crisis the United States and its people now faces is its growing debt and the weakening debt to GDP ratio.
Trump’s Bitcoin Debt Solution Plan Explained
Trump’s bitcoin debt solution revolves around using Bitcoin and cryptos to manage the US debt. In a recent interview, he proposed that Bitcoin could be used strategically to address the growing financial burden. Making Bitcoin as a strategic reserve was a major part of his plan.
BTC Holdings Owned by Governments
The United States government at present owns nearly 207,189 bitcoins, which is 0.98% of the total holdings. The current value of its entire holdings is $10,458,345,453.
As per a data set published in bitcointreasuries.com, here are the top governments by BTC Holdings.
| Country | No. of BTC | Value | Percentage |
| USA | 207,189 | $10,458,345,453 | 0.987% |
| China | 194,000 | $9,792,600,080 | 0.924% |
| UK | 61,000 | $3,079,116,520 | 0.29% |
| Ukraine | 46,351 | $2,339,674,259 | 0.221% |
| Germany | 22,846 | $1,153,204,853 | 0.109% |
| El Salvador | 5,748.76 | $290,181,998 | 0.027% |
| Finland | 1,981 | $99,995,571 | 0.009% |
| Georgia | 66 | $3,331,503 | 0.0% |
China is the country which holds the most number of BTCs after the USA. It owns nearly 194,000 BTC (0.92%), valued at $9,792,600,080. The UK, Ukraine and Germany are also top players with 61,000, 46,351, and 22,846 BTCs respectively.
The Feasibility of Trump’s Plan
The current price of Bitcoin is $55,645.47 and its market cap is $1,095,191,354,069. For Trump’s plan to work, each Bitcoin would need to be worth $180 million. Critics argue that expecting BTC to reach such an astronomical value is unrealistic.
Peter Schiff, a financial expert, opines that Trump’s proposal is unrealistic. He claims that the idea of Bictoin reaching such high values without causing inflation is logically inconsistent.
Bitcoin Annual Price Change Analysis
This analysis shows how Bitcoin’s value fluctuates each year. It is capable to provide insights into growth trends.
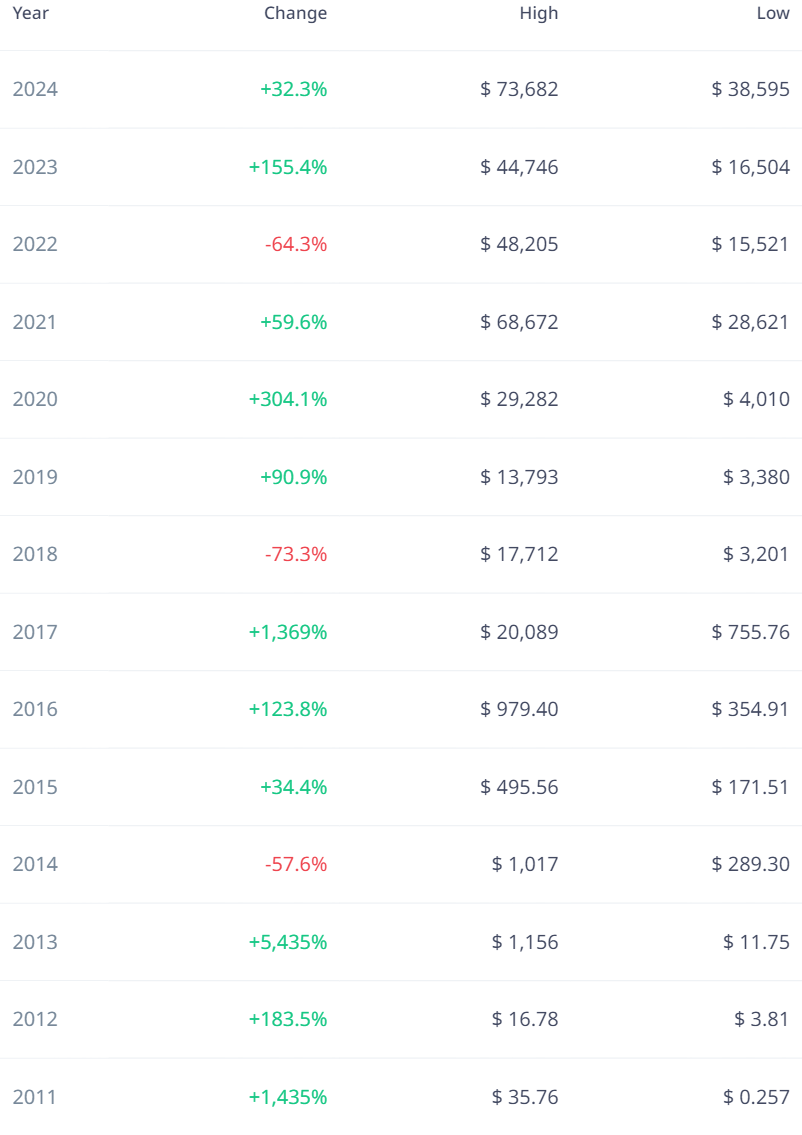
In 2023, the annual price change of Bitcoin was +155.4%. In 2013, 2011 and 2017, Bitcoin witnessed massive changes of +4,435%, +1,435% and +1.369%. Since 2011, only three times that Bitcoin witnessed a negative yearly price change. In 2018, 2022 and 2014, it marked negative changes of -73.3%, -64.3% and -57.6%. This year the value stands at around +32.3%.
Potential Impact on the Crypto Industry
If Trump’s plan were to gain traction, it could have significant impacts on the crypto industry. Increased government involvement in Bitcoin could lead to more regulations. But, it could also boost confidence in Bitcoin.
BTC Historical Price Change Analysis
In the last 24 hours, Bitcoin has seen a rise of 5.0% ($2,134 change). Year to Date, the change is +30.3%, which is $12,799. In the last six months, a change of +27.6%, that is around $11,907, has been recorded. In the Q1 of 2024, the BTC provided a return of +68.7%. But, the last quarter, that is the Q2 of 2024, was a period of great volatility. The period ended with an unimpressive return of -12%. In April and June, BTC saw negative returns of -14.7% and -7.02%. In May, it witnessed a positive return of +11.1%. In the second quarter’s closing price was just $62,743, far less than the first quarter’s price of $71,262. In the last three months, a negative return of -11.8% was recorded, and in the last 30 days, a return of -4.27% was reported.
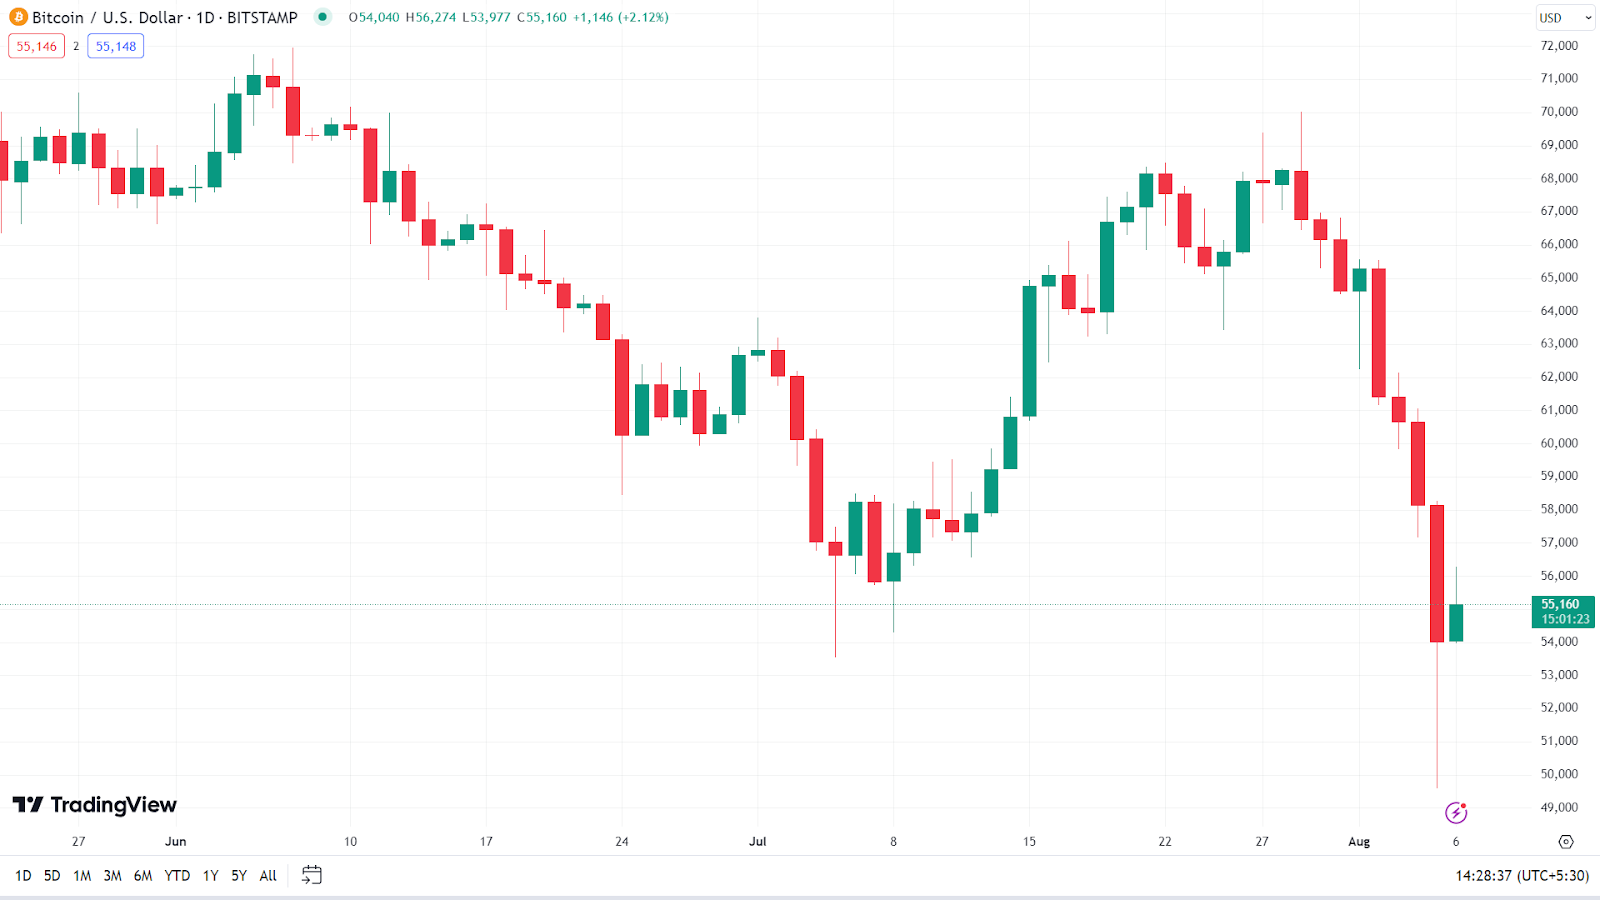
At present the price of BTC stands at around $55,124. In the beginning of the month, the price was around $65,246. On 2nd, 4th and 5th August, the Bitcoin market witnessed long red candlesticks. Between 1st and 6th August, 2024, a steep drop in price occurred in the market. The trend we are witnessing now in the market is in stark contrast to the one we saw last month, when the price experienced an upward momentum between 8th July and 28th July. Actually, it was in late July, specially on 29th July, that this new selling pressure stepped in. Between 29 July and 5th Aug, we see only one green candle.
Endnote
Trump’s proposal to use Bitcoin to tackle the $35 trillion US debt is bold. While it highlights the growing interest in cryptocurrencies as strategic assets, it also raises questions about feasibility and market impact. By examining inflation data, government VTC holdings, historic price movements, quarterly returns, and recent price changes we can better understand the potential and challenges of this idea. Whether Trump’s plan is good or bad for the crypto industry remains uncertain, but it undoubtedly sparks important conversations about the future of the crypto industry and its role in the global economy, especially the US economy.
Also Check Out: Bitcoin and Ethereum Q2 Price Movement Analysis Report