Bitcoin (BTC) Long-Term Holders Locking Consistent Gains: A Sign Of Stability?
In the past few weeks, following a series of corrections, Bitcoin and the broader crypto market have experienced a significant surge from the lower prices of 2024.
The momentum picked up notably on Friday after Jerome Powell, Chairman of the Board of Governors of the Federal Reserve System, announced a shift in policy, hinting at a potential interest rate cut in September. This announcement has fueled optimism among investors, leading to increased market activity.
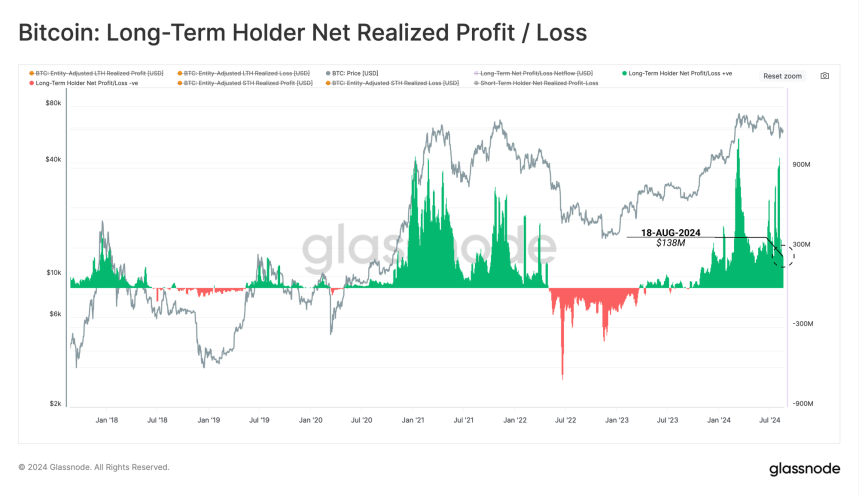
Additionally, valuable data from Glassnode reveals that long-term holders (LTH) are locking in consistent gains of $138 million in profit per day. But what does this mean for the market moving forward?
Bitcoin Daily Capital Inflows Crucial For Price Stability
Bitcoin long-term holders (LTH) have been consistently locking in gains over the past few months, even amid the market’s uncertainty and volatility. According to the Bitcoin Long-Term Holder Net Realized Profit/Loss chart from Glassnode, LTH are currently selling Bitcoin at a rate of approximately $138 million per day. This selling pressure serves as a crucial benchmark for the market, indicating the amount of new capital that must flow into Bitcoin daily to counterbalance the selling and stabilize the price.

If daily inflows into Bitcoin fall short of this $138 million benchmark, the price could potentially face downward pressure due to LTH’s ongoing sales. This dynamic underscores the delicate balance between buyer demand and LTH’s profit-taking activities.
As the market continues to navigate this phase, Bitcoin’s price action will be particularly interesting to watch in the coming weeks. Whether new investor inflows can match or exceed this selling pressure will be key to determining BTC’s next major move.
BTC Breaks Past $64,900: What’s Next?
Bitcoin is currently trading at $64,360, as of this writing, after enduring weeks of aggressive selling pressure, fear, and uncertainty that caused its price to dip to $49,577 just 20 days ago.
Now, BTC is flirting with the $65,000 mark following two successful daily candles closing above the crucial 200-day moving average—a key indicator that investors use to identify a bullish or bearish market structure.
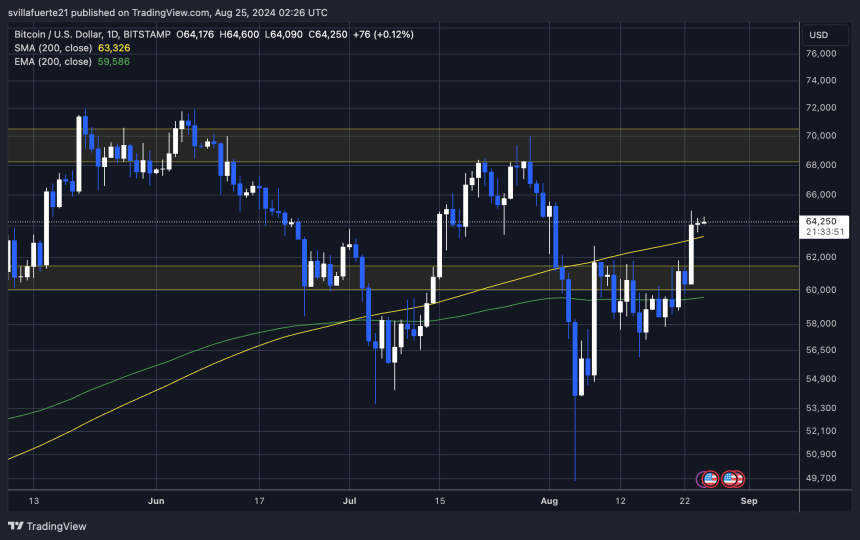
This development suggests that Bitcoin is regaining strength, but it must hold above this indicator and ideally test it as support to sustain the uptrend.
If BTC can maintain this level, breaking past $65,000 should be a straightforward task, with the next target likely around $67,000. However, if the price fails to hold above the 200-day moving average near $63,000, Bitcoin may be at risk of retesting local demand levels around $60,000.