Bitcoin Breaks $64,000, But This Pattern Could Mean Bull Run Isn’t Safe
On-chain data shows the Bitcoin Supply in Profit indicator has been forming a pattern recently that could put the bull run into jeopardy.
Bitcoin Supply In Profit Has Seen Multiple Dips Into “Transition” Zone Recently
As an analyst in a CryptoQuant Quicktake post explained, the recent “Supply in Profit” trend could suggest a potential entry into the transition zone for Bitcoin.
The Supply in Profit here refers to an on-chain metric that, as its name suggests, keeps track of the percentage of the total circulating BTC supply that’s currently holding some net unrealized profit.
The indicator works by going through the transfer history of each coin on the network to check the price at which it was last moved. As the previous transaction of any coin is likely to represent the last time it changed hands, the price at its time could be considered its cost basis.
If this previous transfer price for any coin is lower than the current spot price of the cryptocurrency, then that particular coin is holding a net gain right now. The Supply in Profit adds up all coins that satisfy this condition and calculates what part of the supply they make up for.
There also naturally exists an indicator called the Supply in Loss, which works similarly to the Supply in Profit, except that it keeps track of the tokens of the opposite type.
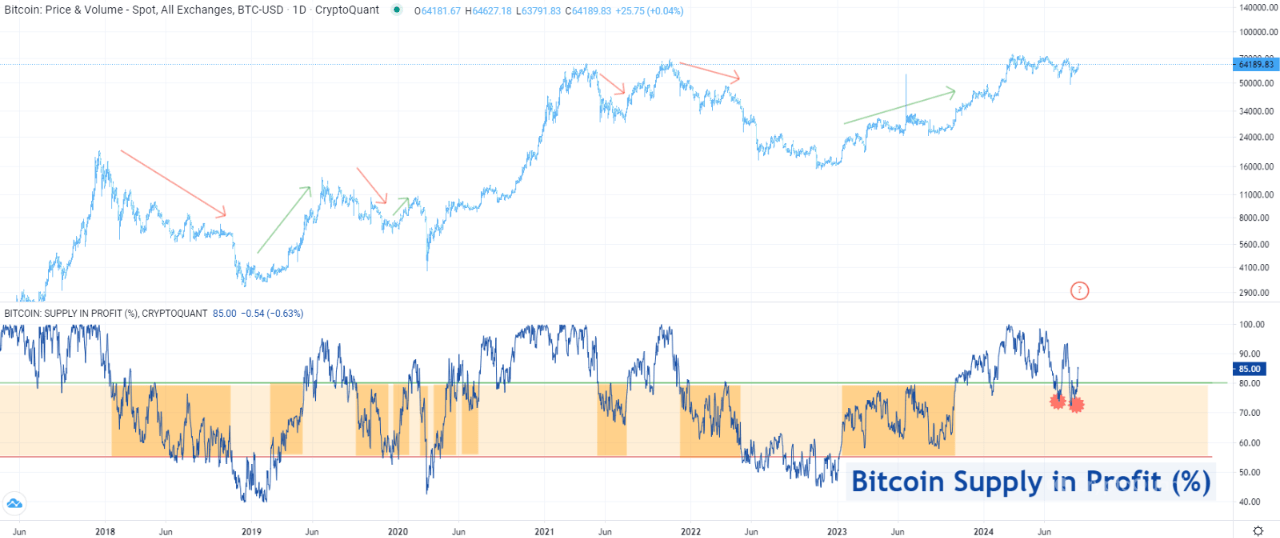
Now, here is a chart that shows the trend in the Bitcoin Supply in Profit over the last few years:

As displayed in the above graph, the Bitcoin Supply In Profit is currently at 85%, meaning 85% of all tokens in circulation are holding profits. This is a notable value and has historically corresponded to the bull market phase of the cycle.
That said, the metric has only reached the current value after the latest price recovery to the $64,000 level, as it had slipped under the 80% mark earlier, which had put it inside the transition zone between bull and bear phases.
While it’s certainly not a negative development that BTC has recovered back into the bull market zone, the recent pattern may raise doubts about whether this recovery can last.
The chart shows that the indicator also saw the same trend of dipping into the transition zone and recovering in July. That surge didn’t last for too long.
The quant has also pointed out how the Bitcoin Supply in Profit has been in an overall downward trajectory in the last few months, raising the chances of the metric going down again shortly.
In the scenario that the indicator does witness another drawdown into the transition zone, then it’s possible BTC could end up going through a period of downturn that may even lead to a new bear market.
It only remains to be seen how the Bitcoin price, and thus, the Supply in Profit, develop in the coming days.
BTC Price
Bitcoin has enjoyed a surge of almost 10% in the last seven days, which has taken its price to $63,900.
