Bitcoin’s August Candle Hints at Major Reversal—Are Bulls About to Take Over?
As August draws to a close, Bitcoin price action has caught the attention of market analysts who believe the current monthly candle could be one of the most significant in the cryptocurrency’s history.
The end-of-month price movement has sparked discussions about a potential trend reversal, particularly among those closely following technical analysis.
However, while some analysts are optimistic, others urge caution, reminding traders that the month is not over, and external factors could still influence Bitcoin’s trajectory.
August Candle Shows Dragonfly Doji
One of the most intriguing aspects of the current Bitcoin price chart is the formation of a potential “dragonfly doji” candlestick on the monthly time frame.
In a recent post on X, an analyst from HODL15Capital referred to this candle as “arguably the most interesting monthly candle in Bitcoin’s history.” Notably, the dragonfly doji is a Japanese candlestick pattern that typically indicates a potential reversal in price direction.
It forms when the open, high, and close prices are nearly the same, but the low price is significantly lower, creating a long lower shadow. This pattern often suggests that sellers were in control during the early part of the month, but buyers pushed the price back up by the close, signaling strong bullish momentum.
Bitcoin Bulls About To Take Over?
The potential dragonfly doji on Bitcoin’s monthly chart has sparked optimism among some traders and analysts who believe it could indicate a strong reversal in Bitcoin’s price trend.
Javon Marks, a well-known crypto analyst on X, commented on the significance of this monthly candle. He noted that if Bitcoin closes the month with a dragonfly doji, it would represent the largest seller rejection (the strongest bull presence) since March 2020.
Marks further pointed out that a similar pattern in 2020 preceded one of Bitcoin’s most significant bullish movements during the previous bull cycle, suggesting that history could repeat itself.
However, while forming a dragonfly doji is often seen as a bullish signal, it’s worth noting that it does not guarantee future price action.
The pattern indicates that the market has rejected lower prices, but it doesn’t necessarily mean a sustained uptrend will follow. As some have cautioned, the month is not yet over; therefore, the candles are yet to close, and a lot can change in the 4 days of trading left.
Additionally, fundamental factors such as macroeconomic events, particularly the US news event set to occur this week or perhaps market sentiment, can all play a significant role in determining Bitcoin’s next move.
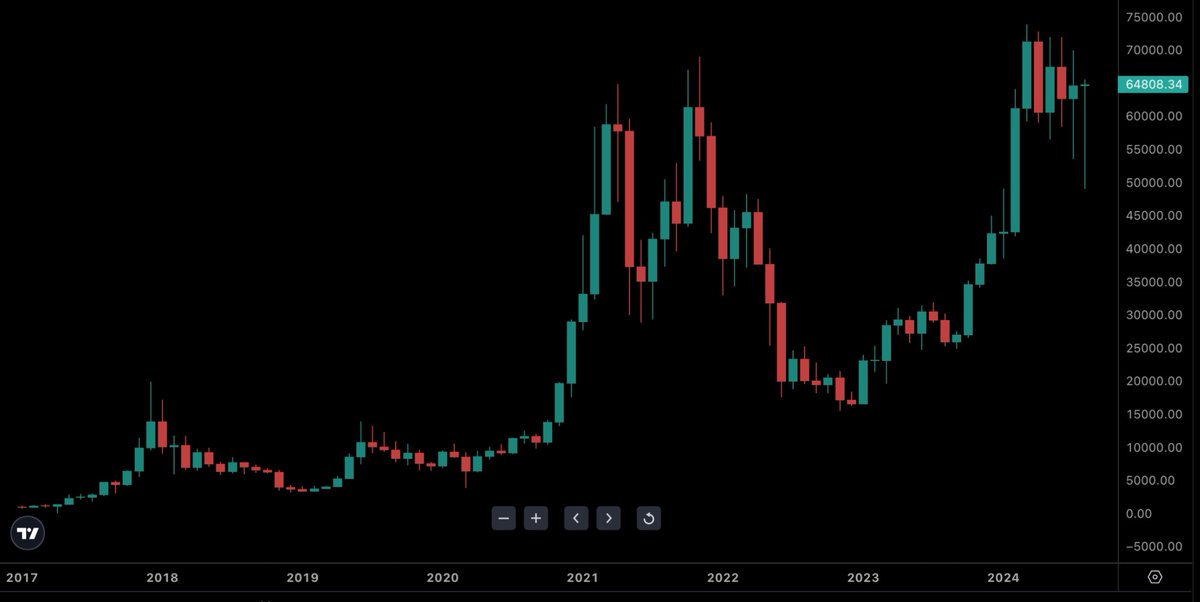
Featured image created with DALL-E, Chart from TradingView