What’s Next For Bitcoin, Ethereum, And Ripple, As September Starts Bearish?


The post What’s Next For Bitcoin, Ethereum, And Ripple, As September Starts Bearish? appeared first on Coinpedia Fintech News
The cryptocurrency market has resumed September on a bearish note. This comes after Bitcoin and Ethereum ETFs had a steep fall on the charts. Consequently, Blackrock, the 3rd largest Bitcoin holder has liquidated some of its position. This has resulted in FUD amongst a few investors.
With this, questions like “Is the crypto bull run delayed?” and “Will the crypto bull run kickstart this year?” have spammed the internet. Scroll down as, in this article, we have covered the possible price targets for Bitcoin, Ethereum, and Ripple to clear all your doubts.
BTC Price Retests Its Important Support Zone
Amid increased selling pressure within the market, the Bitcoin price has plunged 8.40% within the past week and 9.61% during the past month. Moreover, the price has recorded a 24-hour low of $57,136, indicating a rising negative influence in the crypto market.
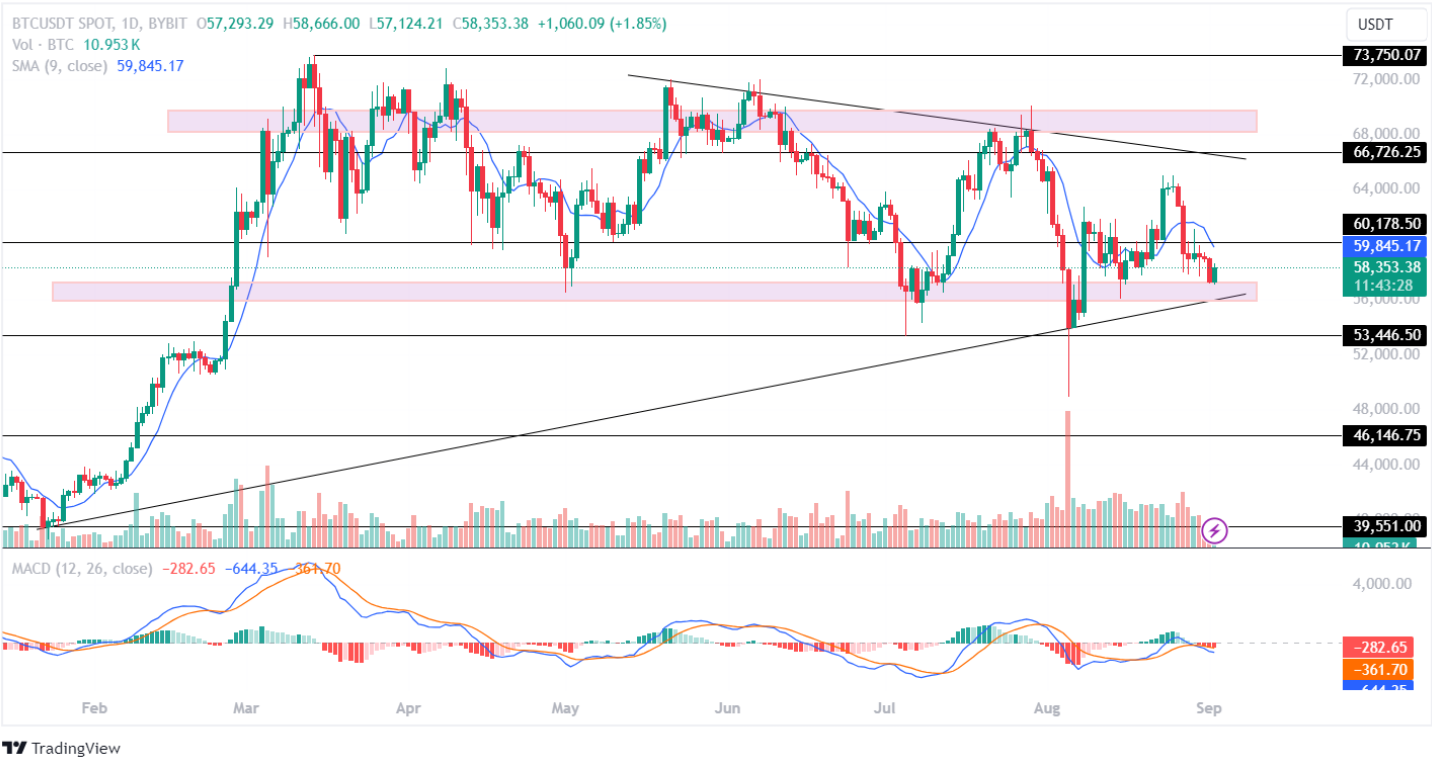
The technical indicator, MACD has recorded a constant red histogram in the 1D time frame. Further, the averages show a bearish convergence in the price chart. This suggests a negative outlook for the market leader this week.
If the bulls regain momentum, the BTC price could prepare to test its upper resistance level of $66,000 this month. On the flip side, if the bears continue to dominate the market, Bitcoin price may plunge toward its $53,000 level.
ETH Price On The Verge Of Testing Its Crucial Resistance
Despite recording a jump of approximately 2% within the past day with a trading volume of $14.442 Billion, this altcoin has dropped 7.84% within the past week and 19.91% during August. Moreover, it is on the verge of testing its important resistance level, the outcome of which is uncertain.
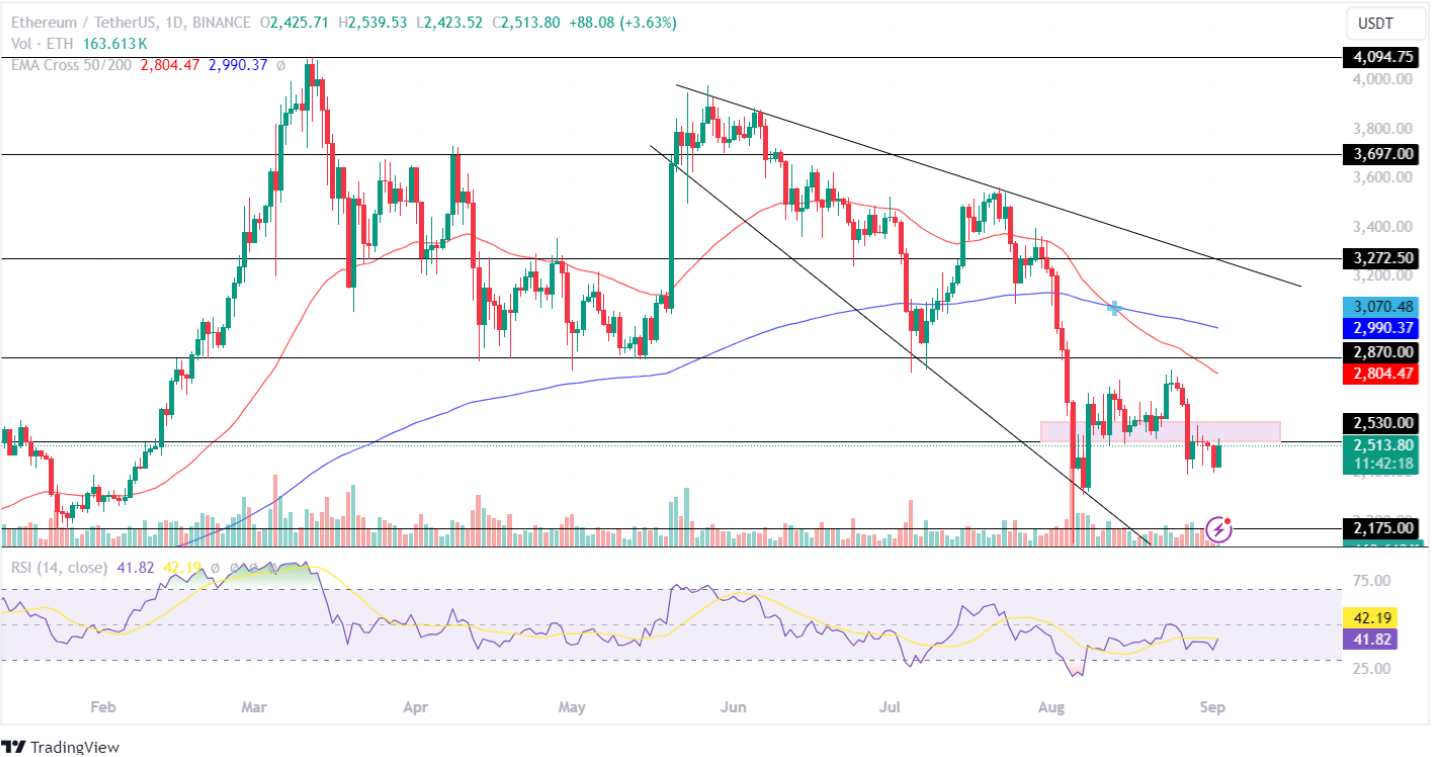
The Relative Strength Index (RSI) continues hovering below the neutral point. However, its average trendline is on the verge of recording a bullish convergence. This suggests a mixed sentiment for the altcoin leader in the market.
Maintaining the price above its resistance level of $2,530 could set the stage for the Ethereum price to head toward its upper resistance level of $2,870 in the coming time. Conversely, a bearish action could pull the price of ETH crypto toward its lower support of $2,175.
Ripple Price Records Increased Bearish Sentiment
In spite of winning the Ripple vs SEC case, the XRP price has continued trading under a bearish sentiment by dropping ~1% within the past day. Moreover, it has dropped 6.45% over the past week and has a YTD return of (-)9.74%. This highlights a long-term bearish action.
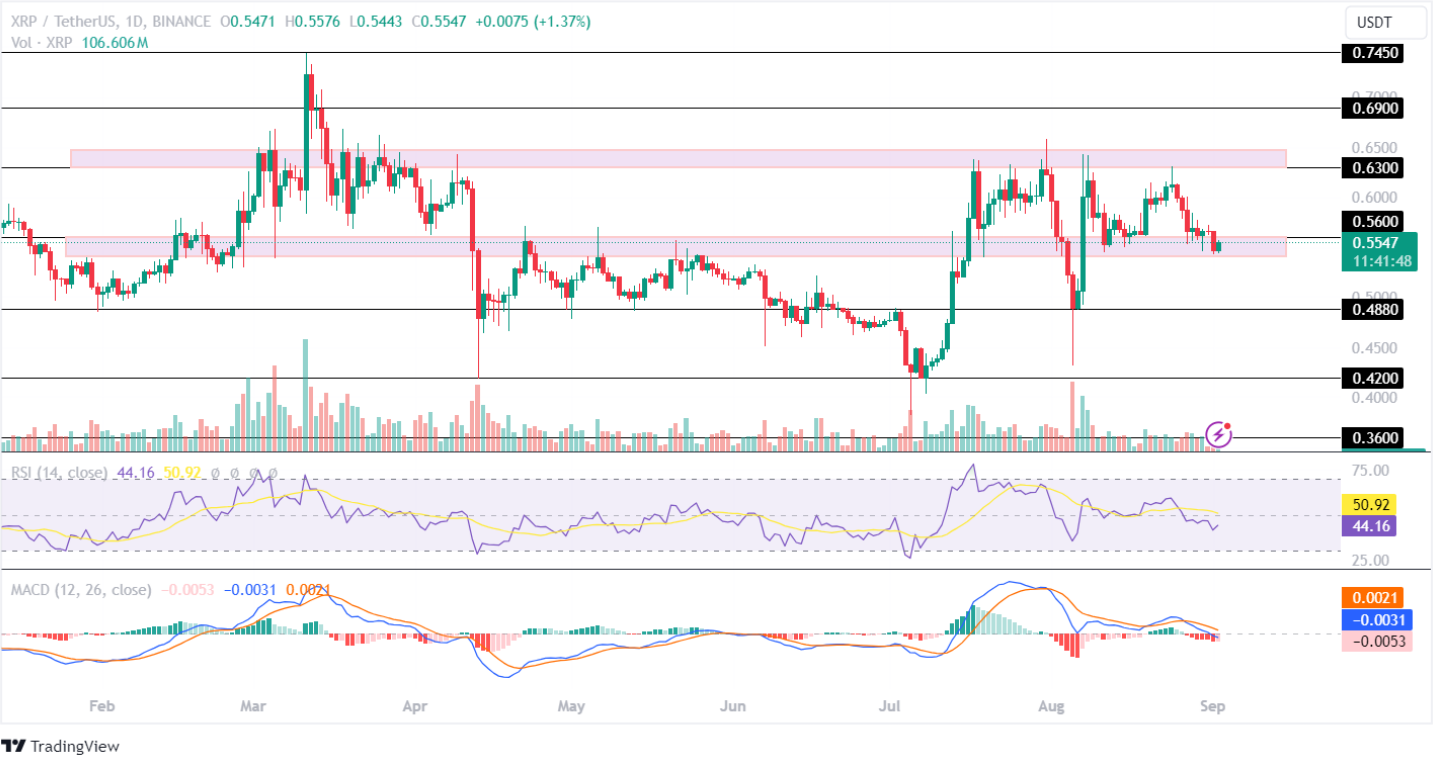
The technical indicators RSI and MACD constantly record a negative price trend in their respective price chart in the 1D time frame. This indicates that the XRP price will continue losing value in the coming time.
If the bulls hold the price above its crucial support level of $0.560, the Ripple price will retest its resistance level of 0.630. Negatively, if the bears gain control, the XRP crypto will plunge toward its low of $0.4880.