Critical Bitcoin Indicator: Analyst Foresees Major 75% Correction Ahead
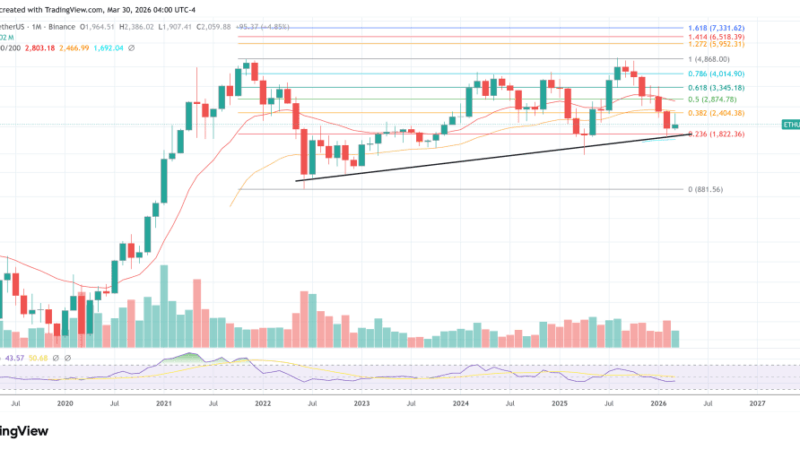
The Bitcoin price has been unable to break out of its current downtrend after losing the $60,000 mark this week, trading as low as $57,790 on Tuesday. However, one indicator is pointing to further price corrections for the largest cryptocurrency on the market that could send the coin well below current levels.
Bitcoin Faces Major Risks
In a recent social media post, crypto analyst Ali Martinez has pointed to the Stochastic Relative Strength Index (RSI) on Bitcoin’s 2-month chart, which has recently indicated a trend reversal from bullish to bearish.
This is noteworthy because historical patterns over the past decade show that similar signals have often preceded significant price corrections of 84%, 59%, and an average of 75.5%.
The Stochastic RSI is a momentum oscillator that measures the level of a security’s closing price relative to its price range over a specific period. When it indicates a bearish trend, it suggests that the asset may be overbought and due for a price drop.
Interestingly, the last notable trend reversal occurred in 2022 when Bitcoin was trading around $60,000. Following that signal, the cryptocurrency plummeted to a cycle low of approximately $16,000 before embarking on a recovery that culminated in new all-time highs of $73,700 in March of this year.
If the current bearish trend holds, Bitcoin could face a dramatic decline. Should a 75% correction materialize from its current trading level of $57,000, the largest cryptocurrency could potentially drop to around $14,200 per coin.
Such a significant downturn would likely dampen bullish expectations for the market, especially in a year marked by the Halving event that took place in April, which historically has been a catalyst for price increases.
Can BTC Bounce Back After September?
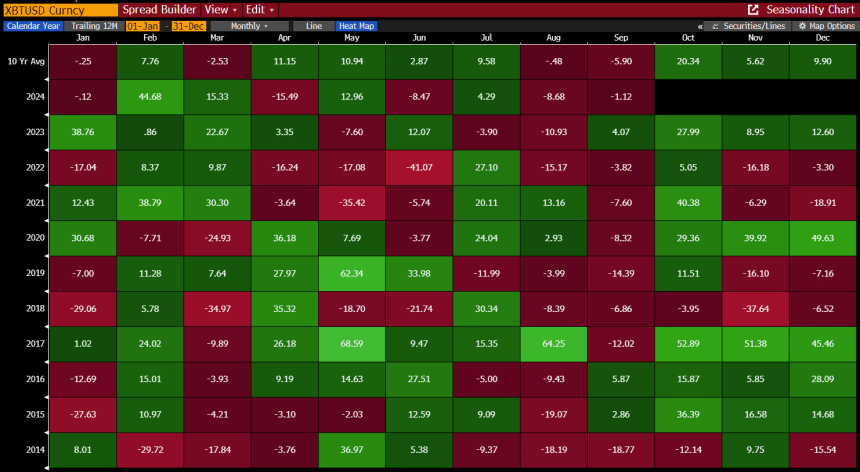
In addition to the bearish sentiment in the market, which could spell short-term trouble for BTC, the leading cryptocurrency faces a challenging September, historically known as its worst performing month.
Market expert Alex Thorn emphasizes that over the past decade, Bitcoin has experienced declines in seven of the last ten Septembers, with losses ranging from 5% to as much as 18%.
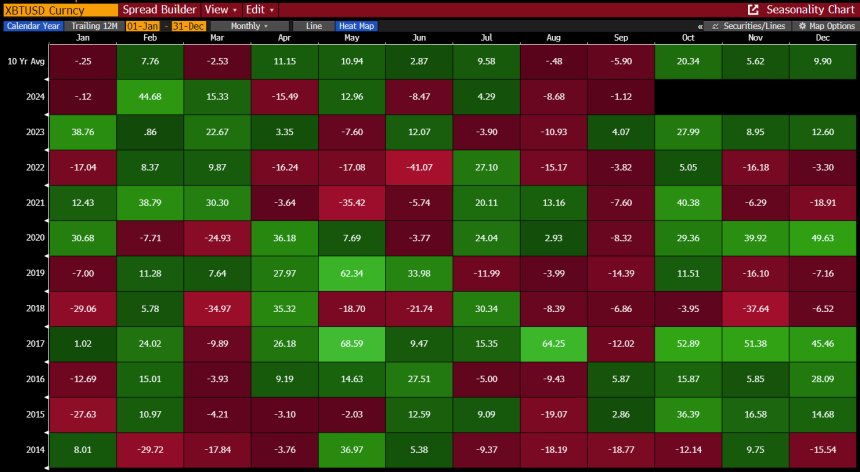
However, Thorn points out that October tends to provide a stark contrast to September’s declines. Historically, October has been Bitcoin’s best month, with the cryptocurrency often rebounding significantly. Gains in October have typically ranged from 20% to 52%, making it a critical month for bullish investors.
If Bitcoin can maintain lower support levels and successfully navigate September’s challenges, the market could be poised for a robust performance in October.
Featured image from DALL-E, chart from TradingView.com