DeFi Tokens Pump as Injective Eyes Bull Cycle, AAVE Faces Founder’s Sell-Off Impact!

The post DeFi Tokens Pump as Injective Eyes Bull Cycle, AAVE Faces Founder’s Sell-Off Impact! appeared first on Coinpedia Fintech News
With Bitcoin dangling below the $57,000 mark with no clear trend direction, the altcoin market has grown volatile. Amid the increased volatility, the pump and dump in AAVE and a reversal in Injective bring entry opportunities. So, let’s look at the price analysis of these DeFi tokens.
Injective Double Bottom Reversal Chances?
With a bearish channel pattern in the daily chart, the Injective Protocol is in a declining trend since April 2024. The increased bearish influence over the DeFi Token results in a death cross between the 50-day and 200-day EMA.
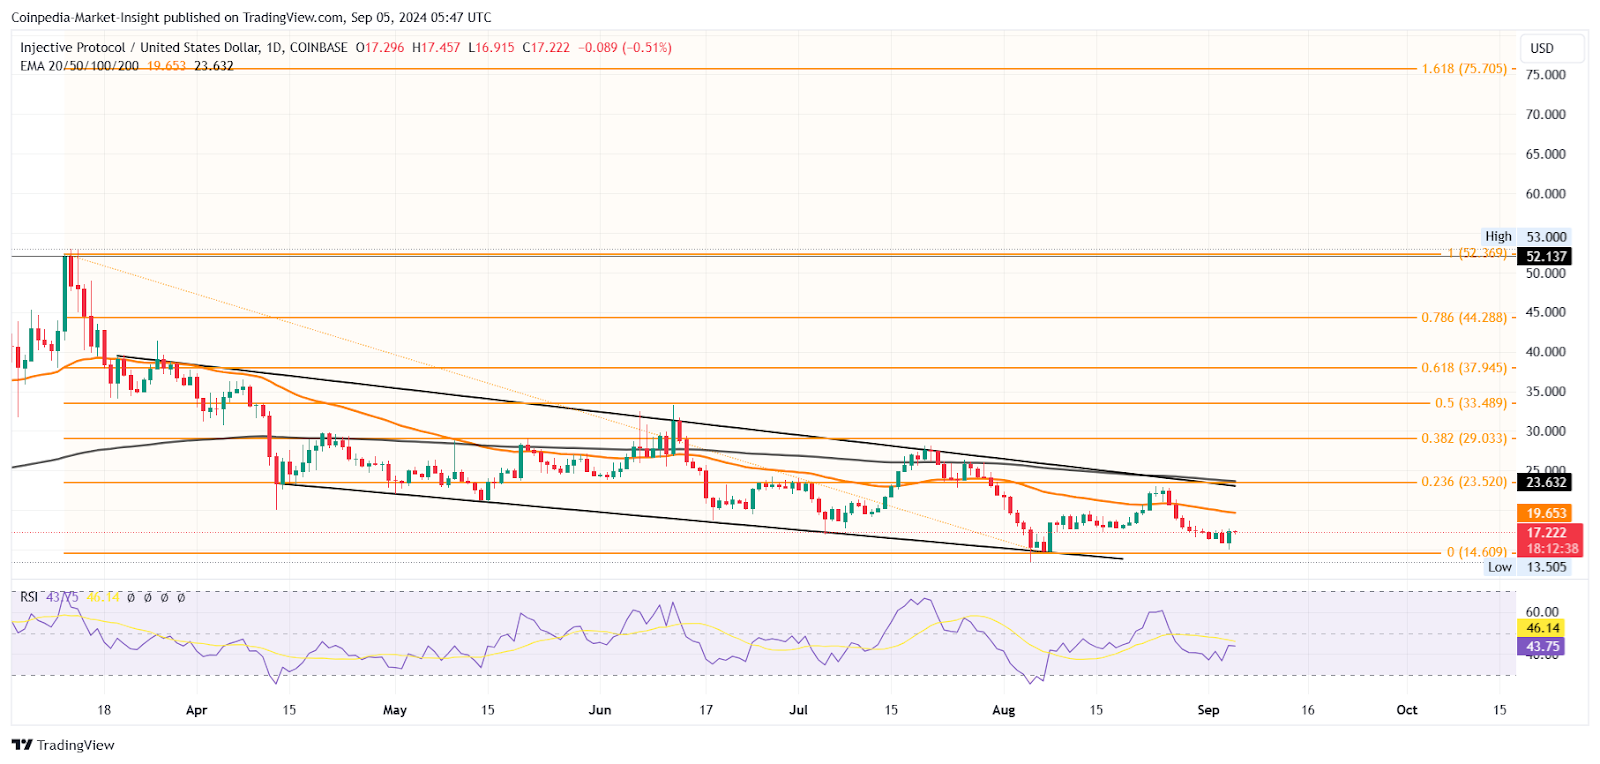
However, based on the Fibonacci levels, the crucial support at $14.60 is casing a potential bottom reversal. The Injective Protocol has a market cap of $1.677 billion and has increased by 10.90% in the last 24 hours.
Currently, the INJ token is trading at $17.17 and teases a new bull cycle. With a bullish engulfing candle formed yesterday, the chances of a bull cycle have increased significantly. However, the lack of bullish continuation can prolong the consolidation phase near the crucial support and increase the chances of a breakdown.
On the contrary of a breakdown view, the bullish RSI Divergence predicts an upcoming bullish attempt to challenge the overhead resistance trend line near the 23.60% Fibonacci level. The overhead resistance coincides with the 200-day EMA, increasing the supply pressure.
Optimistically, a breakout rally in the DeFi Token could challenge the 50% level at $33.48. On the flip side, the breakdown of $14.60 could find support at $12 and $10.
Read our Injective (INJ) Price Prediction 2024-2030, for long-term price targets
Will The DeFi Token AAVE Surpass $142?
With a market cap of almost $2 billion, Aave ranks at the 35th position in the crypto market. The DeFi token has increased by 8.29% over the past 24 hours and is currently trading at $133.
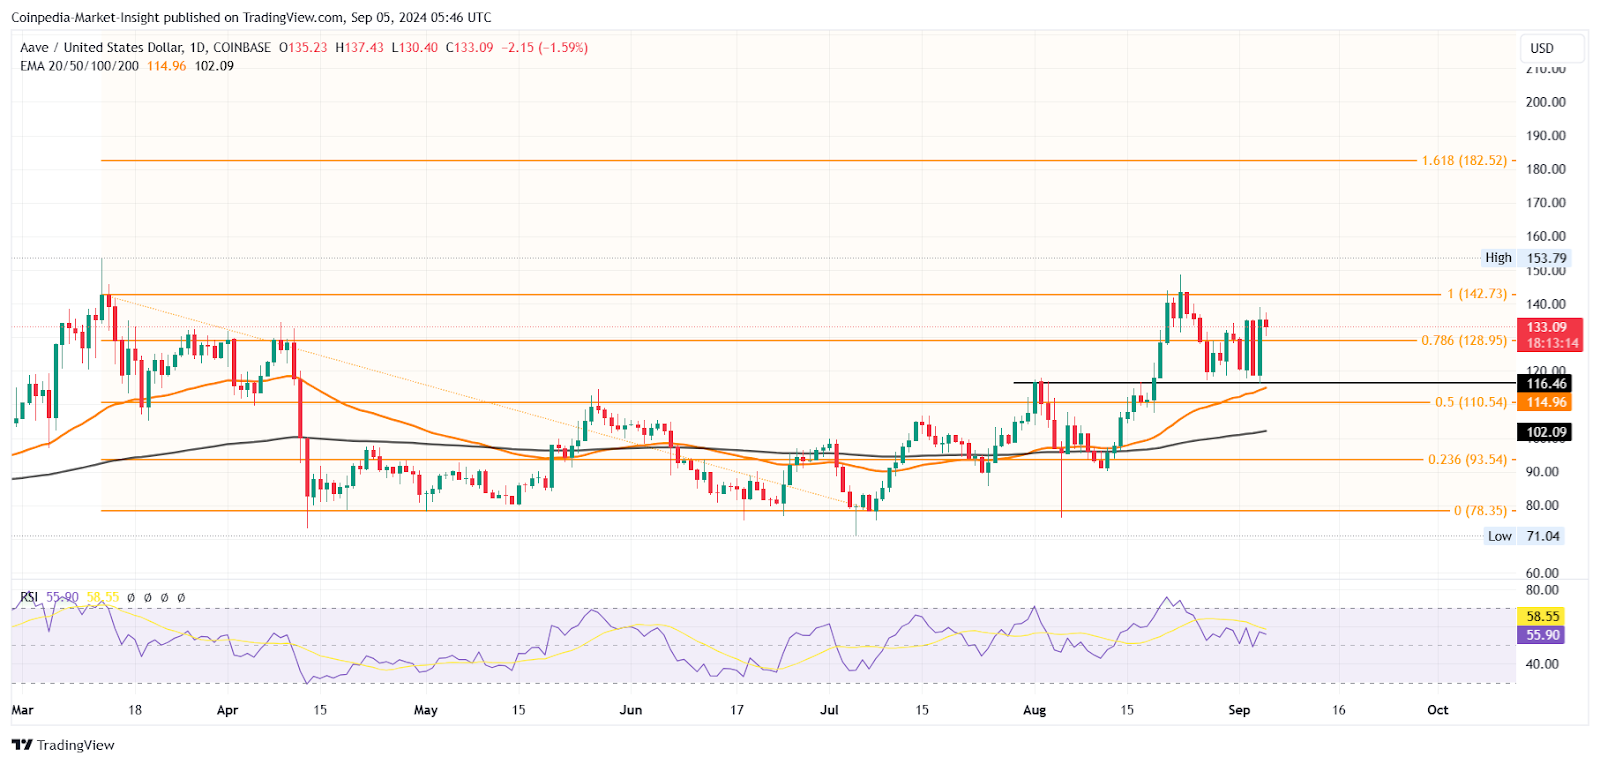
The daily chart reveals a bullish cycle in motion with increased volatility near the $130 mark, with a price movement of more than 10% over the last three days. The upcoming trend for the DeFi token remains indecisive. Currently, it is trading above the 78.60% Fibonacci level and is struggling to challenge the $142 resistance level.
Nevertheless, the bullish trend in the 50-day EMA and the 200-day EMA continues, with the RSI line sustaining above the 50% line. Furthermore, the double bottom pattern still holds, but the bull cycle fails to reach the $142 neckline.
A bullish breakout rally could challenge the $182 or the 1.618% Fibonacci level. On the flip side, the crucial supports for the DeFi Token are at $115 and $100, apart from the dynamic 50-day EMA.
However, in recent news, Aave’s founder has sold off $6 million in Aave. Currently, he holds onto the rest of the 243,900 Aave tokens, which are worth $32.7 million. If the founder continues to lose confidence in his project, a sell-off pressure of his magnitude could slide Aave below the $100 mark.
Concerned about Aave’s long-term prospects? Read our AAVE Price Prediction 2024-2030