Ethereum To $4K Again? Analyst Predicts Bull Run As Key Metric Approaches Critical Level
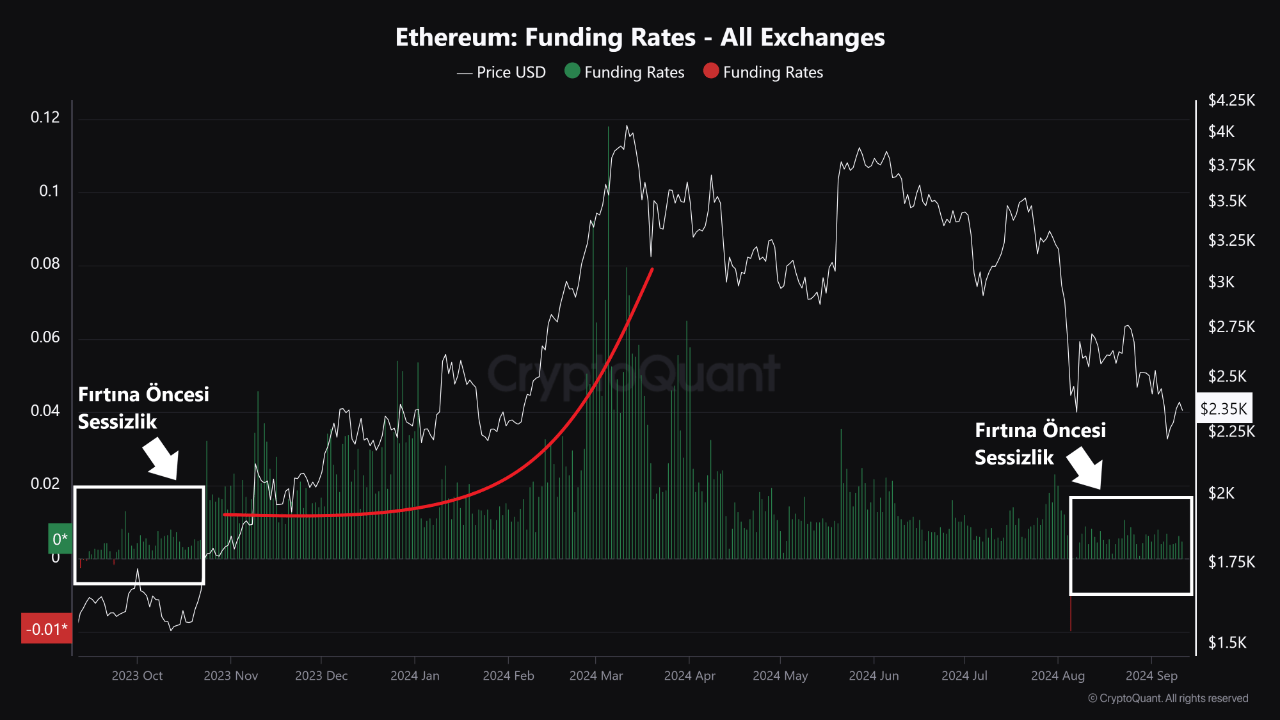
Ethereum appears to have now seen a notable shift in its major metric. Particularly, a recent CryptoQuant analyst, Burak Kesmeci report, highlighted the potential significance of Ethereum’s current funding rates.
The analyst pointed out that similar patterns in the past have been followed by substantial price increases, suggesting that Ethereum might be on the verge of a new surge.
Calm Before The Storm?
Funding rates are a key future market metric, indicating the balance between long and short positions. When the funding rate stays low for an extended period, it can signal market indecision or calm, but if the rate rises sharply, it often precedes a strong price movement.

According to the report by Kesmeci, Ethereum’s funding rates have been hovering between 0.002 and 0.005, a relatively low level last seen in September 2023. The funding rate then spiked above 0.015, followed by a price rally from $1,500 to over $4,000.
The analyst further explored whether Ethereum’s funding rate in September 2024 could signal a similar price movement. The current low funding rates have persisted for about a month, starting from August.
This situation mirrors the period before last year’s significant price surge. September and the final quarter have historically been pivotal times for crypto markets, often seeing increased trading volume and price gains as summer ends.
However, Kesmeci noted:
I can’t say if history will repeat itself, but there’s certainly a rhythm to it. We will wait for Ether’s funding rate to rise above 0.015 to see if the calm before the storm breaks. A move above this level in funding rates is crucial for tracking healthy increases during bull markets.
How Is Ethereum Faring So Far?
While Ethereum hasn’t seen a further decrease following its low of $2,197 last month, the asset hasn’t seen a major price increase in the past weeks.
Instead, ETH has continued to consolidate within a specific range. Following an attempt to create a new all-time high back in March, trading above $4,000, ETH has seen a consistent decline ever since and has remained below $3,000 since August.
So far, the asset has declined 2.7% in the past weeks and has also seen a 0.7% increase in the past 24 hours. However, the asset remains below the $3,000 mark, currently trading for $2,331 at the time of writing.
According to a recent post from a renowned crypto analyst, Alex Clay, on X, ETH might have ended its correction. Clay noted that a “break above $2500 will confirm the beginning of the rally.”
#ETH/USD
Imo we are at the end of the $ETH correction
Looking for some consolidation above the Key Zone + 200 MA & 200 EMA confluence
Break above $2500 will serve a confirmation of the beginning of the rally
#Ethereum turned to be a heavy asset so $10k target is rather… pic.twitter.com/jjGPPUHWE3
— Alex Clay (@cryptclay) September 9, 2024

Featured image created with DALL-E, Chart from TradingView