Top Altcoins to Rally? BNB and OKB Target Bullish Breakouts

The post Top Altcoins to Rally? BNB and OKB Target Bullish Breakouts appeared first on Coinpedia Fintech News
With the crypto market witnessing a dark patch before the Uptober rally brings the sunshine for bulls, CEX tokens are preparing for the next stage. Despite the increasing volatility in the altcoin market, Binance shows a positive trend in price fluctuations, and OKB shows a recovery at hand.
Will a twist of fate drive the short-term breakouts in BNB and OKB tokens for a bull run ahead? So, let’s look at the top CEX tokens to buy before the bull run begins.
Centralized Exchange Altcoins To Watch Out:
OKB (OKB)
In the daily chart, the OKB token shows a bullish breakout of a long-coming resistance trend line. With this breakout rally, the OKB token marks a trend reversal amid the volatile altcoin market.
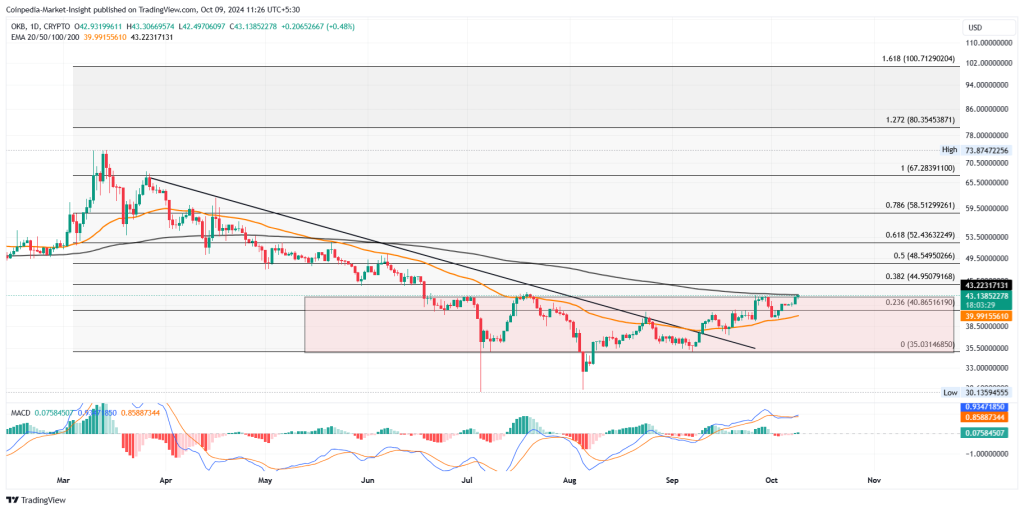
The OKB token price has increased by almost 20% in the last 30 days and has reclaimed the $40 mark. Based on the Fibonacci levels, the recovery rally is challenging the 23.60% level at $42.64.
Furthermore, the recovery run exceeds the 50-day EMA and is now challenging the 200-day EMA. Based on the price action analysis, the consolidation range formed between $35 and $42.64 is on the verge of a bullish breakout if the altcoin exceeds $43.
Hence, the OKB token stands at a bullish crossroads, which can potentially ignite the next bullish rally. Based on the Fibonacci levels, the upside target for the October rally in the OKB token stands at 78.60% and 1.272 Fibonacci levels at $60 and $76, respectively.
Supporting the possibility of a bullish trend, most MACD and signal lines are on the verge of a bullish crossover. Meanwhile, a bullish breakout will likely lead to a golden crossover in the daily chart, boosting the overall OKB sentiment.
Binance Coin (BNB)
In the daily chart, the BNB price action reveals a short-term recovery at play. Furthermore, with the overhead resistance zone near the $600 psychological mark, the short-term price action reveals an ascending triangle pattern.
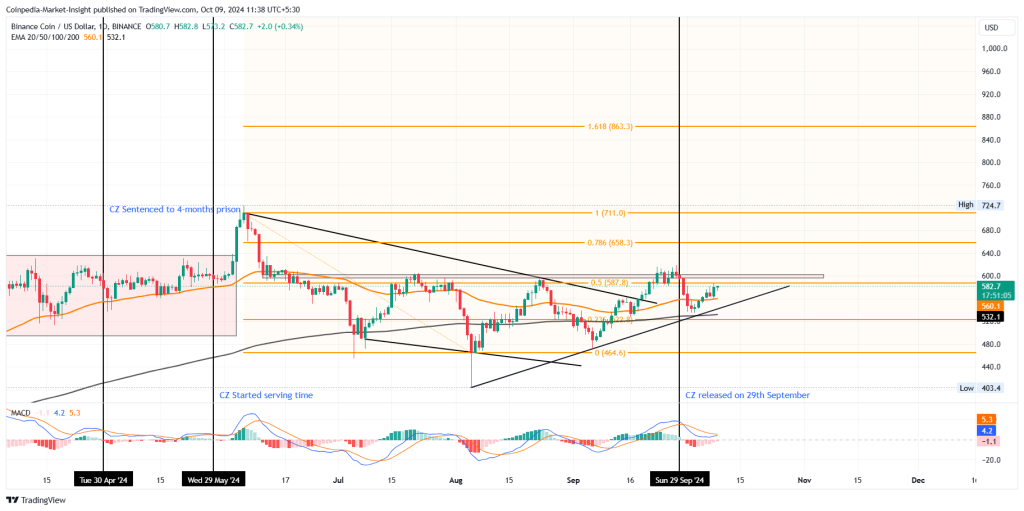
Meanwhile, a long-term consolidation is observed between $464 and the $600 supply zone. Currently, the altcoin is trading at $583 following the 2.91% recovery last night.
The altcoin is trading above the 200-day and 50-day EMA while challenging the 50% Fibonacci level at $587. Following a bullish engulfing candle, Binance’s possibility of an overhead breakout has increased significantly.
The sideways trend in the 50-day and 200-day EMA in a positive alignment gives a neutral signal. However, the bullish crossover in the MACD and signal lines near the resistance test increases the possibility of a bullish breakout.
In case of a bullish outcome, the uptrend in BNB price could potentially hit $711 or $863. On the flip side, the crucial support for the altcoin is the local support trendline and the 23.60% Fibonacci level at $522.
Wondering if Binance Coin (BNB) price will hit $1,000? Find out now in Coinpedia’s BNB price prediction for 2024 to 2030.