On-Chain Indicator Signals Bitcoin Cycle Top Is Far Ahead – Data Confirms Bullish Outlook

Bitcoin currently ranges between $65,000 and $69,500 following two weeks of bullish price action, sparking renewed optimism among analysts and investors. The prevailing sentiment is that BTC is on the verge of reaching new all-time highs in the coming weeks, with confidence building that March’s cycle top predictions may have been premature.
Key metrics from CryptoQuant reveal that Bitcoin is still far from typical cycle-top conditions, instead signaling a bullish outlook as we move into November. As the U.S. election approaches November 5 and macroeconomic factors continue to shift, price action is expected to remain unpredictable and volatile.
Market participants are watching closely, expecting that geopolitical and economic events could influence BTC’s trajectory. Given this context, many believe the next major move for Bitcoin could catalyze a fresh leg up, potentially breaking through previous highs.
Bitcoin Calm Before The Storm?
Bitcoin is holding firm above $67,000, showing resilience as it edges to a potential breakout above $70,000. However, the current price action indicates that Bitcoin may consolidate below this key level before moving up to new highs in the next leg. Market participants closely watch BTC’s behavior around these price levels, as a sustained push above $70,000 could set the stage for significant gains.
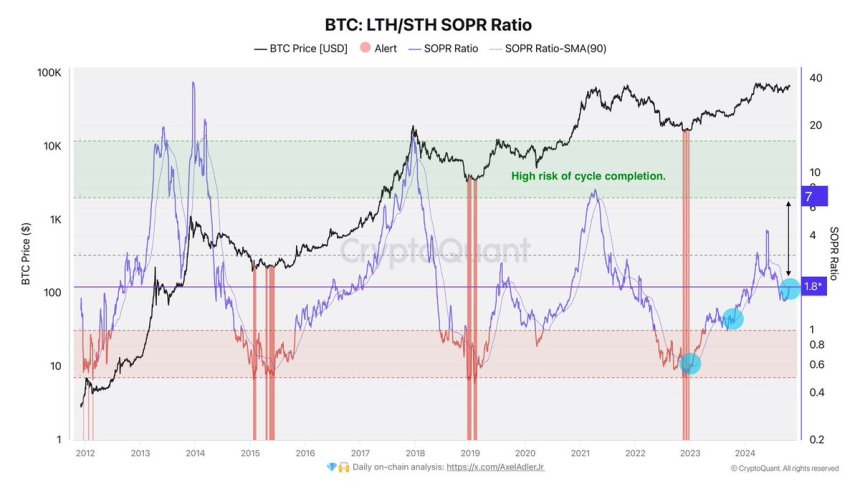
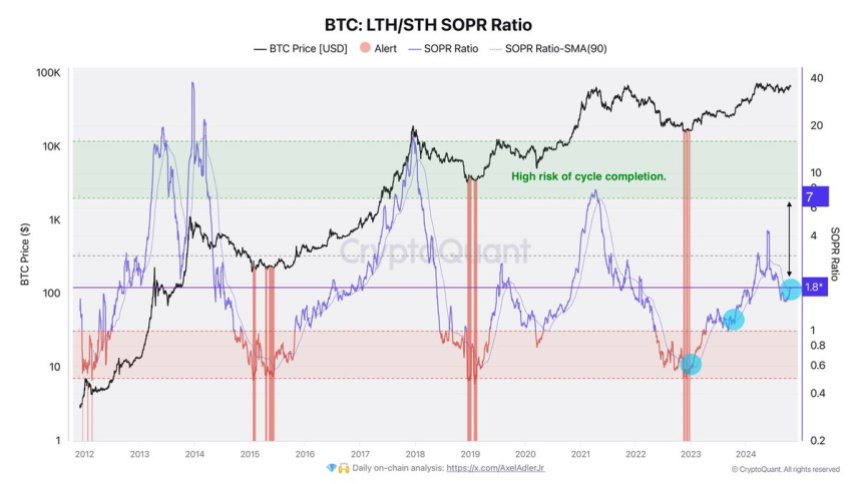
CryptoQuant analyst Axel Adler recently shared critical insights on X, highlighting the current Long-Term Holder (LTH) to Short-Term Holder (STH) SOPR Ratio, which sits at 1.8. This metric is often used to gauge selling pressure and market sentiment, with higher levels indicating increased profit-taking that could signal a market peak.

According to Adler, when this ratio climbs to around 7, Bitcoin will be nearing a cycle culmination. The ratio’s bullish cross with its 90-day moving average reflects a positive outlook, supporting the narrative that BTC remains well below its cycle top.
This metric’s movement and broader market strength paint a favorable picture for Bitcoin’s price action in the coming weeks. The data suggests that Bitcoin still has room to grow within this cycle, providing confidence to long-term holders and investors looking for continued upside.
BTC Technical Levels
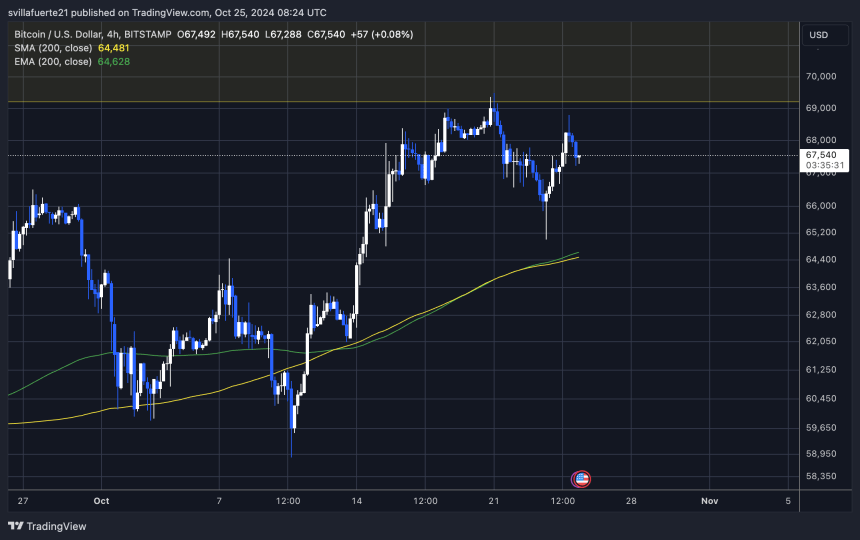
Bitcoin is trading at $67,500, facing challenges after failing to maintain its bullish structure on the 4-hour chart. The price couldn’t set a new high above $69,500, marking a potential shift in momentum. A crucial support level now sits at $65,000, the local low that previously held the bullish trend intact. Holding above this level is essential to prevent a broader retrace and maintain confidence among bulls.

Currently, price action remains indecisive, leaving the direction for the coming days unclear. A breakout above $69,500 would restore the bullish structure, likely drawing more buyers into the market and signaling another rally attempt. Conversely, a break below the $65,000 support would signal a retrace, potentially leading BTC to lower demand zones as bulls look to regroup.
The current consolidation phase highlights the importance of these levels in determining Bitcoin’s short-term trajectory. With both bulls and bears vying for control, BTC’s ability to hold above $65,000 will be crucial to retaining bullish sentiment.
Featured image from Dall-E, chart from TradingView

