As TRX Price Hits 52-Week High, Weekly Bull Run Targets $0.2621


The post As TRX Price Hits 52-Week High, Weekly Bull Run Targets $0.2621 appeared first on Coinpedia Fintech News
With a market cap of $15.39B, Tron remains the 10th biggest crypto market. Following a massive surge last night, the TRX prices take a quick U-turn back for a retest.
Delaying a weekly chart breakout rally, Tron stands at a crossroads with the price action traders paying close attention. Will TRX create a new all-time high with a wedge breakout? Find out more about the latest TRX price analysis.
TRON Hits $0.1926
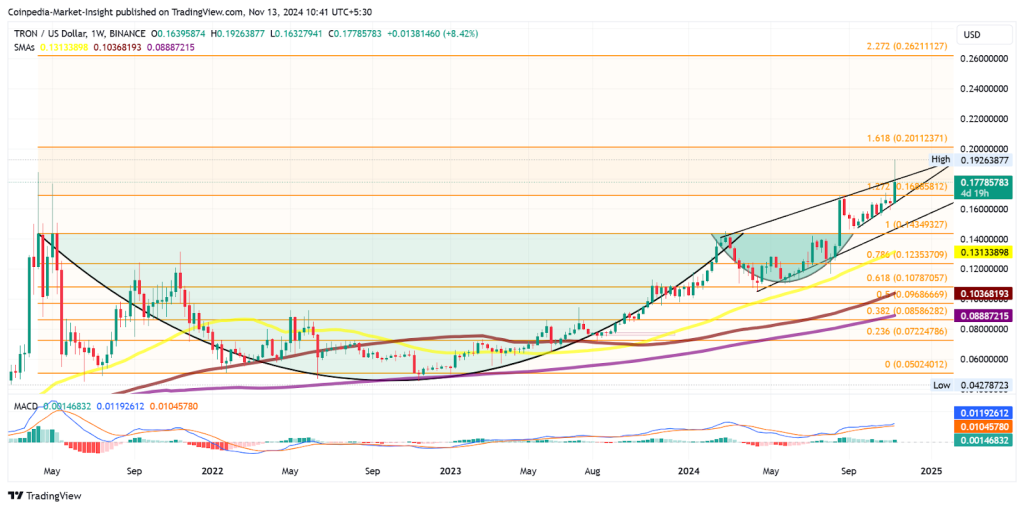
Following the 11% jump last night, the TRX price aimed for a rising wedge pattern breakout. However, the intraday pullback of 6.79% with the broader market pullback delays the breakout rally.

In the weekly chart, the TRX price action shows a bullish engulfing candle, surpassing the 1.272 Fibonacci level at $0.16. The extremely bullish candle accounts for a 6.53% jump this week and is currently trading at $0.1747.
Creating a new 52-week high at $0.1926, the massive demand for TRX price subsided due to the pullback in Bitcoin prices.
As the market takes a step back due to the bullish exhaustion, the rising wedge pattern breakout is delayed further on. As the pullback intensifies, a potential retest of the 1.272 Fibonacci level at $0.1688 is possible.
Technical Indicators:
SMA: The bullish trend maintains a positive alignment in the simple moving average lines in the weekly chart.
MACD: The MACD and signal lines find an uptick to avoid a bearish crossover.
Will TRX Price Hit $0.2621?
The bullish trend will likely continue due to a cup-and-handle pattern breakout in the weekly chart. The neckline for the cup and handle pattern stood at $0.1434. Beyond the rising wedge pattern, a support trendline maintains a rising channel pattern for TRX in the weekly chart.
If the altcoin manages to close above the rising trendline by the end of this week, a bullish rally for TRX is imminent. Using the retracement tool, the upside target for TRX stands at $0.2011 and $0.2621.
Hence, the bullish trend shows an upside of 50%. Conversely, the $0.1688 is a potential retest of the 1.272 Fibonacci level.
Will the bull run in Tron reach $0.50? Find out now in Coinpedia’s latest TRX price prediction for 2024 to 2030.
FAQs
The TRX price targets are $0.2011 and $0.2621, based on the cup and handle pattern breakout and rising wedge breakout expectations.
Key support levels are $0.1688 (1.272 Fibonacci level) and $0.1434 (cup and handle neckline). Resistance stands at $0.1926 and above.
Yes, TRX maintains bullish momentum with a positive SMA alignment, an uptick in MACD and signal lines, and confirmation of key bullish patterns.


