JTO Price Faces $3.18 Test: Can the Rally Extend to $4?


The post JTO Price Faces $3.18 Test: Can the Rally Extend to $4? appeared first on Coinpedia Fintech News
As the bullish reversal in JITO Finance struggles to surpass a crucial resistance at $3.18, the V-shaped recovery takes a sudden halt. As the buyers struggle to sustain momentum above the $3.00 psychological mark, the broader market anticipates a sideways shift.
However, the lower price rejection keeps the hope of a bullish reversal alive. Will this reversal rally result in a breakout surge to the $4.00 psychological mark? Let’s find out in our latest JITO price analysis, which is filled with technical insights.
JTO Price Analysis
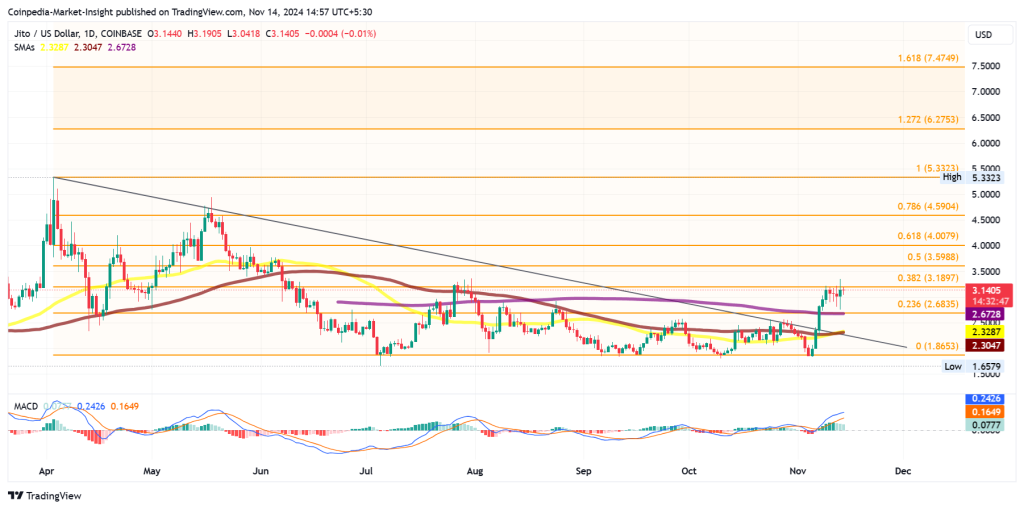
In the daily chart, the JTO price action shows a V-shaped reversal from a crucial support level, $1.865, which has provided multiple bullish reversals over the past four months.

In the recent V-shaped reversal, the JTO price surged almost 70% to hit the $3.18 mark. This level coincides with the 38.20% Fibonacci level. Currently, it is facing resistance to find a closing price above this resistance level.
The 38.20% Fibonacci level has resulted in a bearish reversal once before in July. However, the ongoing reversal rally has surpassed the long-coming resistance trendline, marking a bullish breakout of a descending triangle pattern.
Furthermore, the recovery rally has surpassed the 200-day SMA line, increasing the upside chances. Currently, it is trading at $3.1432 with a minor intraday growth of 0.07%.
However, the market price surged by 4% last night, resulting in a bullish candle.
Technical Indicators
Amid the increasing bullish sentiments, the 100-day and 50-day SMA lines have given a positive crossover. Meanwhile, the 200-day SMA continues to act as a dynamic support.
Further, the minor consolidation below the 38.20% Fibonacci level has led to a declining intensity in the MACD histograms.
Will JTO Price Cross $3.18?
Based on the Fibonacci levels, a bullish breakout of about $3.18 could result in a price surge to the $4 psychological mark coinciding with the 61.80% Fibonacci level. On the flip side, the crucial support for the DeFi token stands at $2.6835 and $2.30.
As Solana crosses $200, are you curious how high the SOL price will go in 2024? Check out Coinpedia’s Solana price prediction to find price targets above $100.
FAQs
The critical resistance level for JTO Finance is $3.18, which aligns with the 38.20% Fibonacci retracement.
A breakout above $3.18 could lead to a price surge toward the $4 psychological mark, coinciding with the 61.80% Fibonacci level.
The crucial support levels are $2.6835 and $2.30, which could come into play if the price fails to sustain above current levels.


