Decentraland and Sandbox Targets Unveiled: $1.56 and $2.26 in Sight!
The post Decentraland and Sandbox Targets Unveiled: $1.56 and $2.26 in Sight! appeared first on Coinpedia Fintech News
With the broader market recovery, the altcoin segment has been set ablaze. In this heating demand, the Metaverse tokens are making a comeback. With Decentraland and Sandbox tokens surging nearly 200% in the past three weeks, the bull run is aiming for an extended rally.
Will this extended rally result in a price surge to the last 2021 levels? Let’s find out in the latest Coinpedia’s multi-asset price analysis.
Decentraland (MANA) Eyes $1.56
In the daily chart, the MANA price action shows a falling channel breakout finally gaining momentum. After stopping the pullback phase at the $0.25 social support, the MANA price trend took a sideways shift. This led to a consolidation phase between the $0.25 and $0.38 mark.
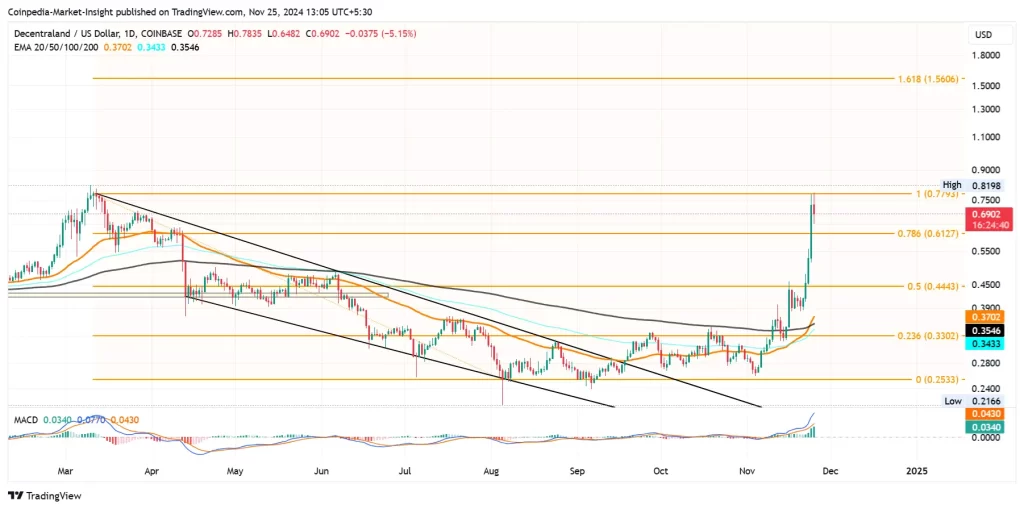
However, the recent reversal rally has broken above the overhead ceiling at the 23.60% Fibonacci level. The massive surge has resulted in a golden crossover between the 50 and 200 EMA lines.
The MANA price has surged by 157% over the last three weeks. It is currently trading at $0.6816 and has completed a rounding bottom reversal. Currently, the higher price action in the MANA price trend challenges the decline at $0.7793.
Based on the Fibonacci levels, the uptrend continuation will likely target the $1.56 mark. Hence, the MANA price analysis shows an upside potential of 130%.
Sandbox (SAND) Price Targets $2.24
Similar to Decentraland, Sandbox Price Action shows a Rounding Bottom Reversal Value. Surprisingly, the Rounding Bottom Reversal takes place after the Falling Channel Breakout Run.
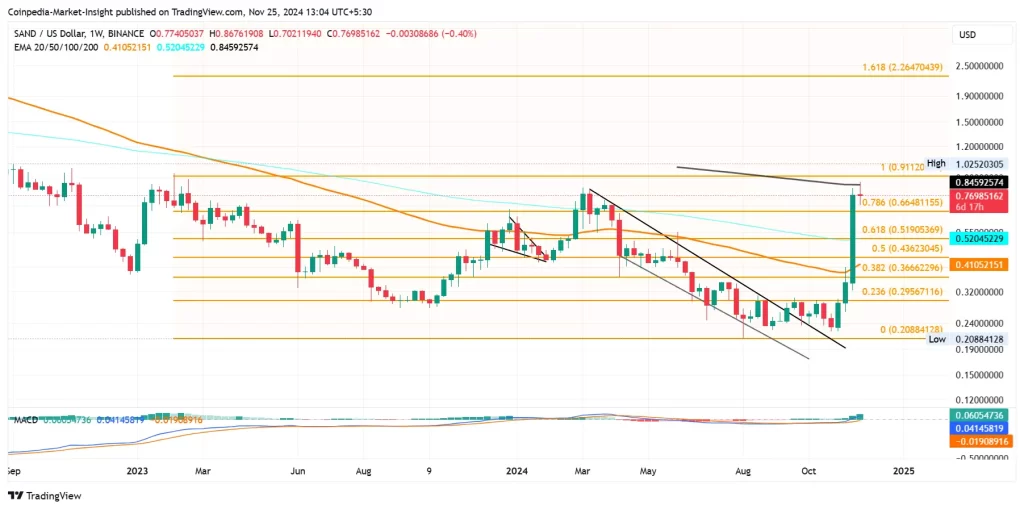
The Post-Retest Reversal exceeds the 23.60% Fibonacci Level at $0.29, or the 23.60% Fibonacci Level. Currently, the uptrend has reached the $0.76 mark of following the 76% surge last night.
The massive influx of demand has resulted in a Golden Threshold within the 50-day and 200-day EMI line. Over the past three weeks, the uptrend in Sandbox has resulted in a 241% surge from the bottom of $0.2231.
Using the Fibonacci Retestment Tool, the $0.91 breakout rally will likely reach the $2.26 mark. Hence, the Sandbox Price Analysis shows an upside potential of nearly 200%.
Will the GALA games token price hit $0.10 in 2024? Find out now in Coinpedia’s GALA price prediction, filled with price insights, technical analysis, and predictions for 2024 to 2030.
FAQs
Both tokens have experienced bullish breakouts, backed by high demand in Metaverse projects and broader market recovery trends.
MANA targets $0.7793 resistance, with Fibonacci levels pointing toward $1.56, offering a 130% upside potential.
Sandbox’s Fibonacci retracement tool suggests a rally to $2.26 after exceeding $0.91 resistance, showing nearly 200% growth potential.
