Ripple Price Analysis: Is the Worst Over for XRP After 10% Weekly Correction?

Ripple recently faced rejection at the 100-day MA of $2.5, leading to a substantial decline.
However, the price is now approaching a confluence of key support zones, increasing the likelihood of consolidation in the mid-term.
XRP Analysis
By Shayan
The Daily Chart
XRP recently encountered heightened selling pressure at the critical 100-day moving average ($2.5), leading to a rejection and subsequent price retracement. However, the asset has now reached a significant support zone, which includes:
- The 0.5 Fibonacci retracement level ($1.9)
- The 200-day moving average ($1.7)
- The expanding wedge’s lower boundary
This confluence of key support levels suggests strong demand in this price range, likely preventing further downward movement. Given these conditions, XRP is expected to approach this support range and enter a consolidation phase in the mid-term.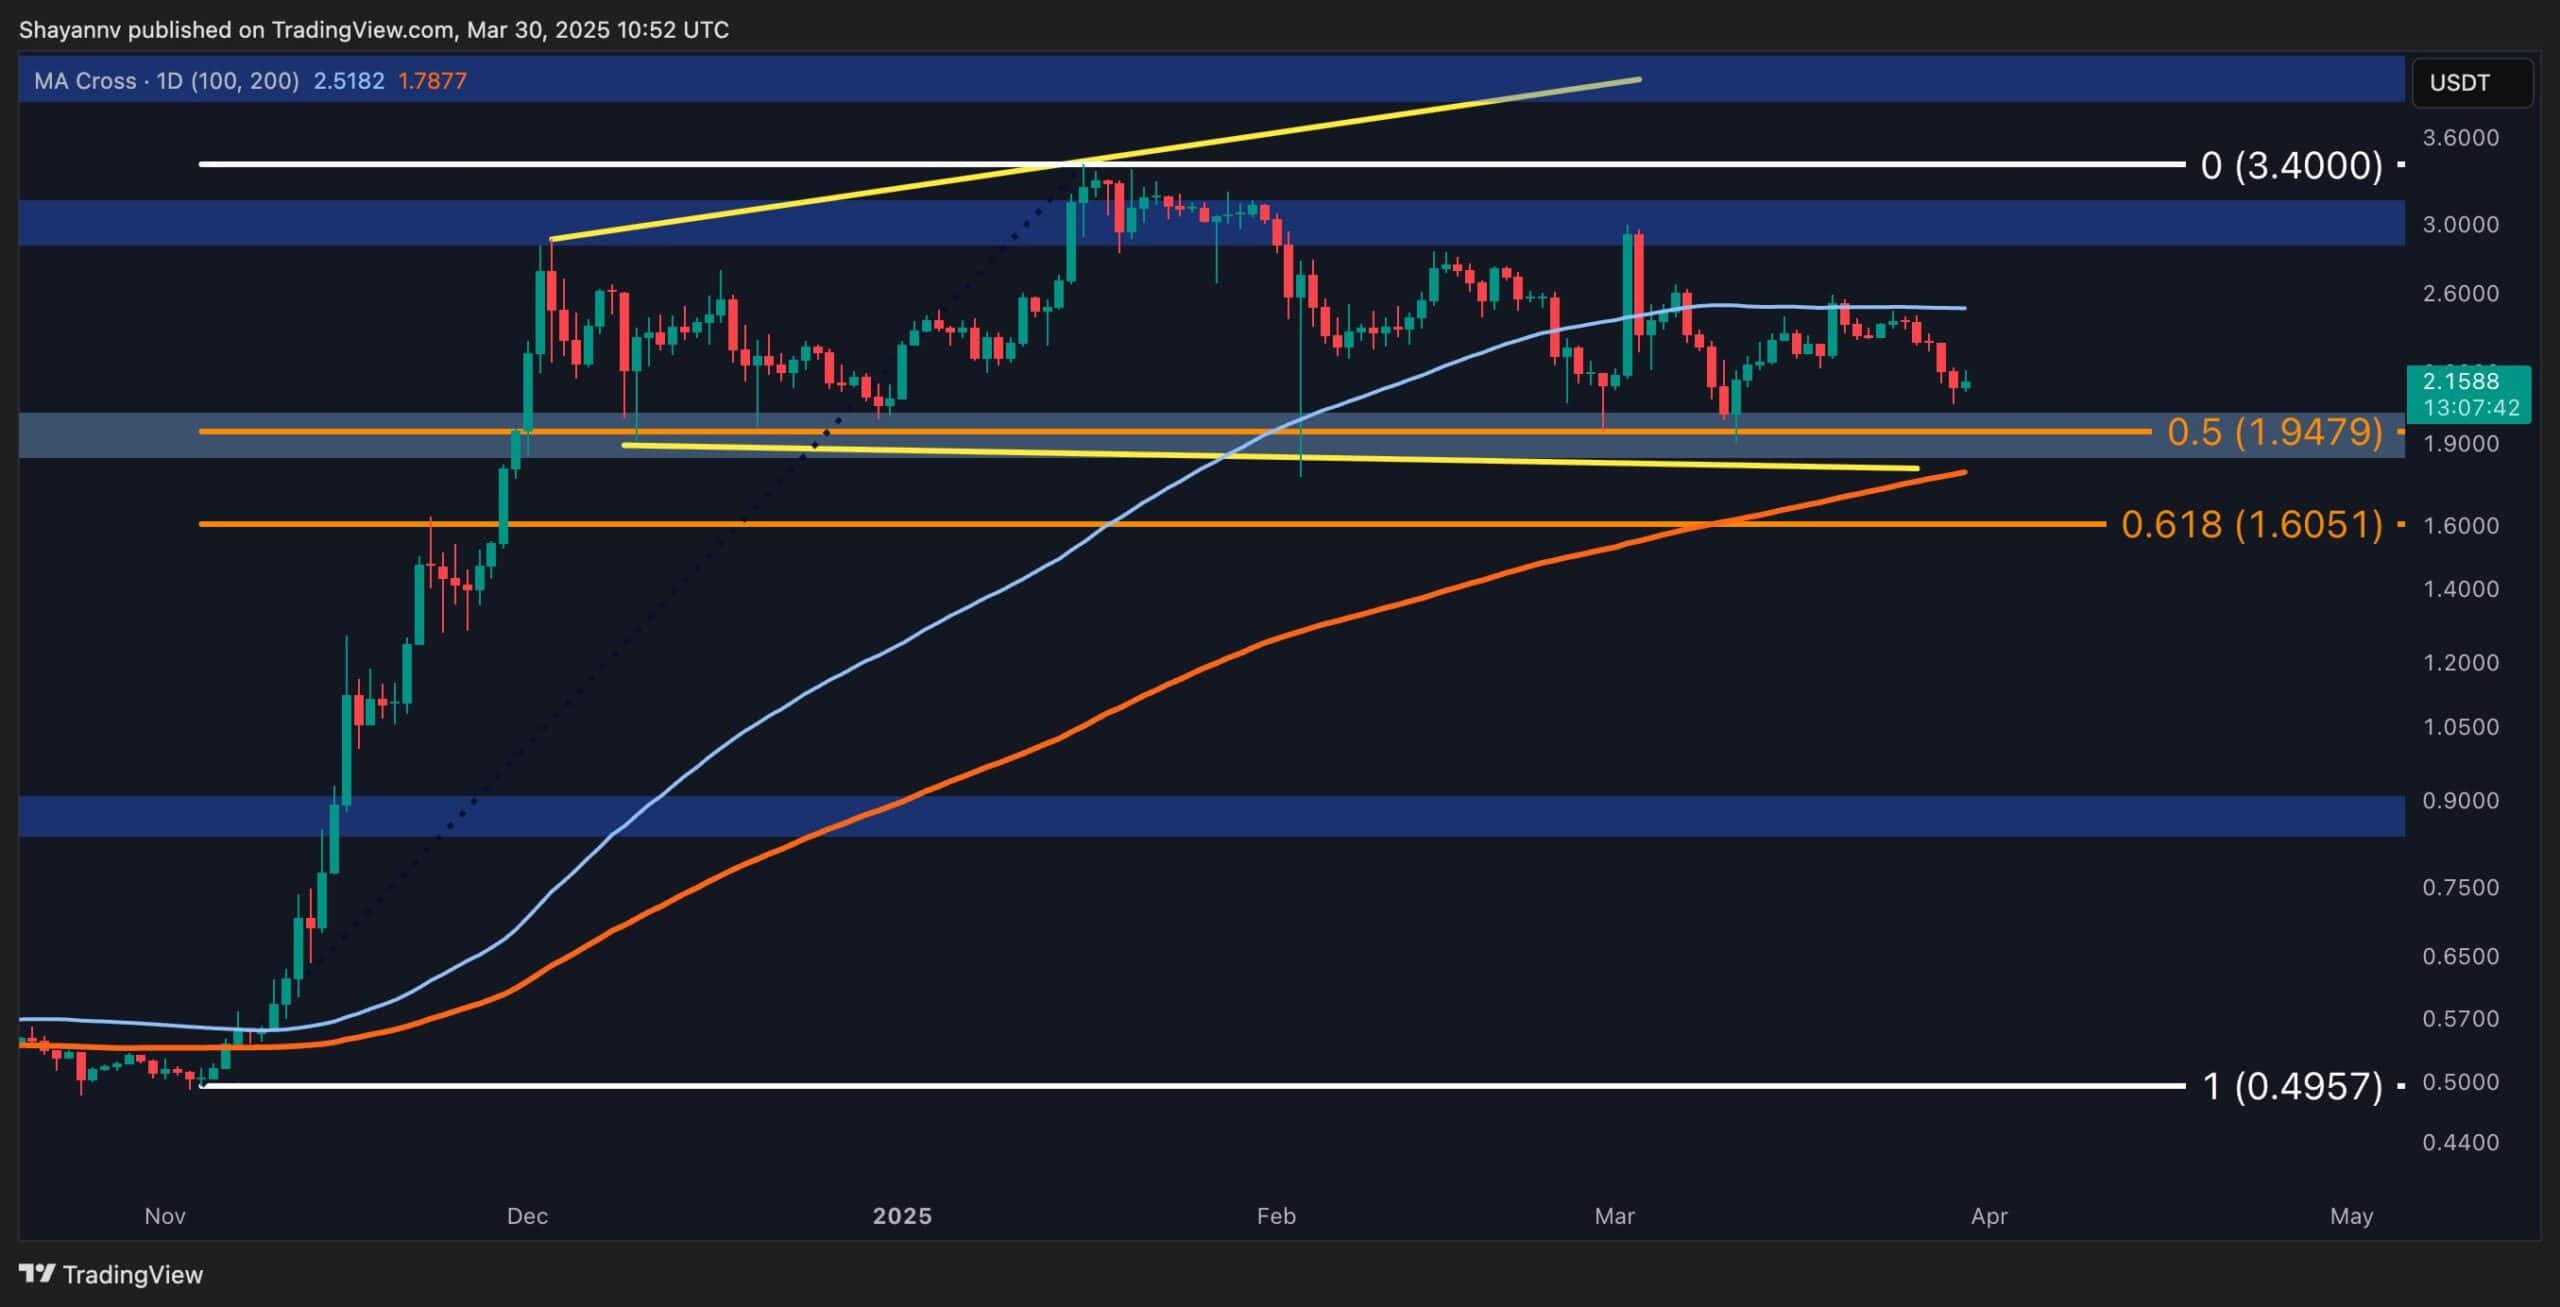
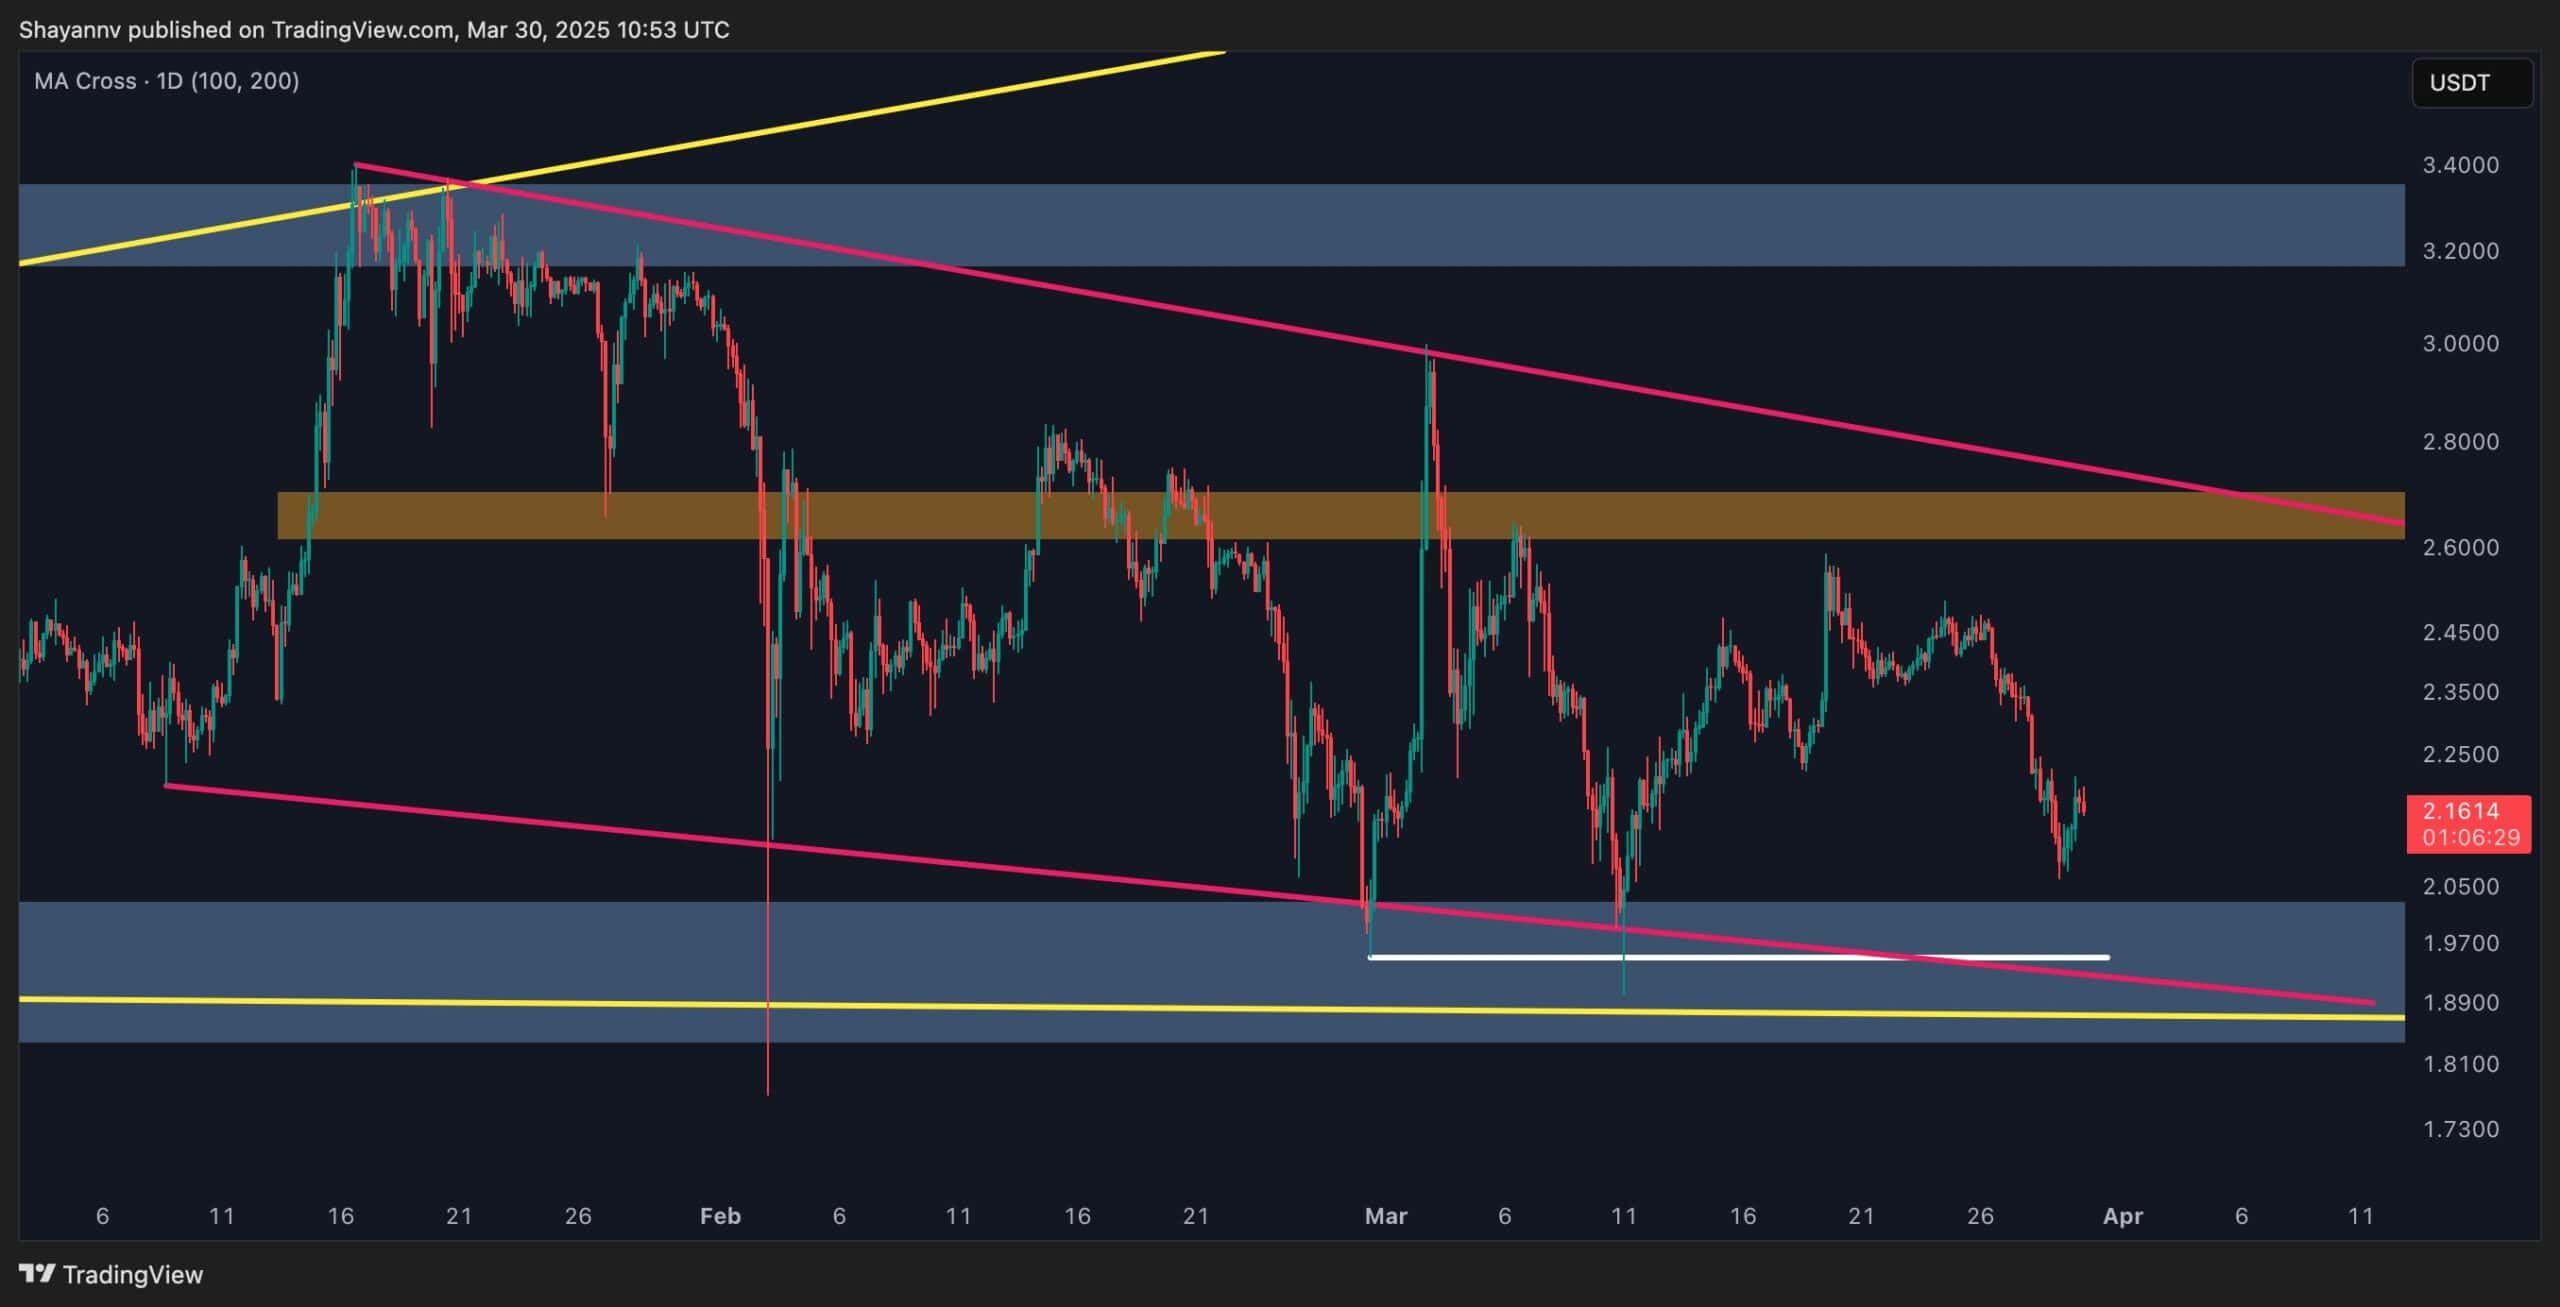
The 4-Hour Chart
On the lower timeframe, Ripple’s recent upward trend faced strong resistance, highlighting weak bullish momentum and a lack of buying pressure. This led to a notable bearish decline, pushing the asset toward the descending wedge’s lower boundary at $1.9, a key level that has repeatedly supported price action.
If XRP fails to hold above this level, further declines may follow. However, given the broader market conditions, the price is expected to stabilize and consolidate around this support range before its next major move.
The post Ripple Price Analysis: Is the Worst Over for XRP After 10% Weekly Correction? appeared first on CryptoPotato.