XRP Price Eyes $2.0 Breakout—Can It Hold and Ignite a Bullish Surge?
XRP price started a fresh increase above the $1.850 resistance. The price is now consolidating and must settle above $2.00 for more gains.
- XRP price started a fresh increase above the $1.850 and $1.950 levels.
- The price is now trading above $1.90 and the 100-hourly Simple Moving Average.
- There was a break above a connecting bearish trend line with resistance at $1.8650 on the hourly chart of the XRP/USD pair (data source from Kraken).
- The pair might extend gains if there is a close above the $2.00 resistance zone.
XRP Price Eyes More Gains
XRP price managed to stay above the $1.750 support zone and started a fresh increase, like Bitcoin and Ethereum. The price climbed above the $1.850 and $1.880 resistance levels.
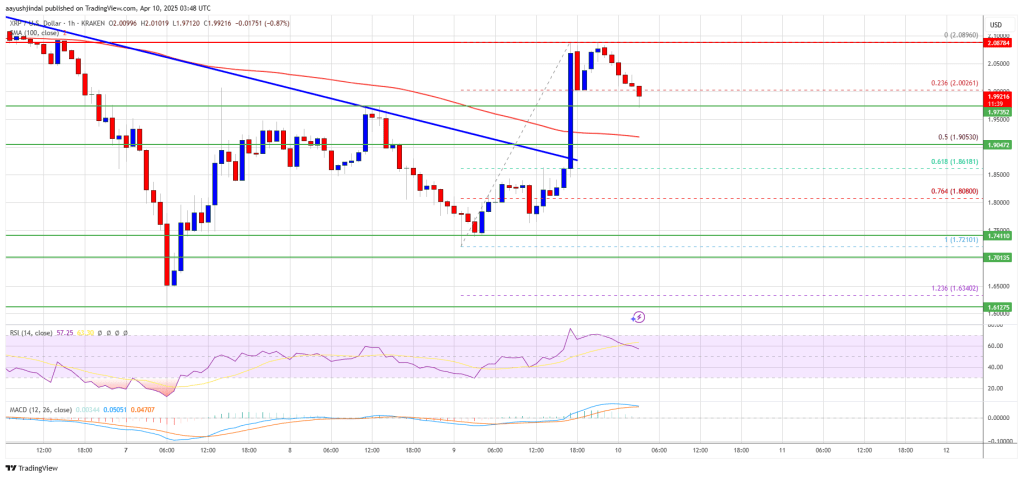
There was a break above a connecting bearish trend line with resistance at $1.8650 on the hourly chart of the XRP/USD pair. The pair jumped above the $1.950 and $2.00 levels. A high was formed at $2.089 and the price is now correcting gains.
There was a move below the $2.050 level. The price dipped below the 23.6% Fib retracement level of the upward move from the $1.7210 swing low to the $2.0896 high.
The price is now trading above $1.950 and the 100-hourly Simple Moving Average. On the upside, the price might face resistance near the $2.00 level. The first major resistance is near the $2.050 level. The next resistance is $2.0880.

A clear move above the $2.0880 resistance might send the price toward the $2.120 resistance. Any more gains might send the price toward the $2.150 resistance or even $2.20 in the near term. The next major hurdle for the bulls might be $2.320.
Are Dips Limited?
If XRP fails to clear the $2.00 resistance zone, it could start another decline. Initial support on the downside is near the $1.9750 level. The next major support is near the $1.90 level and the 50% Fib retracement level of the upward move from the $1.7210 swing low to the $2.0896 high.
If there is a downside break and a close below the $1.90 level, the price might continue to decline toward the $1.850 support. The next major support sits near the $1.80 zone.
Technical Indicators
Hourly MACD – The MACD for XRP/USD is now losing pace in the bullish zone.
Hourly RSI (Relative Strength Index) – The RSI for XRP/USD is now above the 50 level.
Major Support Levels – $1.9750 and $1.90.
Major Resistance Levels – $2.00 and $2.0880.