Ripple Price Analysis: XRP Nears Inflection Point, What’s Next?
XRP continues to trade within a tight consolidation range while Bitcoin and Ethereum dominate recent market headlines. Despite lacking strong bullish momentum, XRP’s price action shows resilience, holding key support zones across both USDT and BTC pairs.
However, both charts suggest that the asset is nearing critical inflection points, where a breakdown or breakout could define the next major move.
Technical Analysis
By ShayanMarkets
The USDT Pair
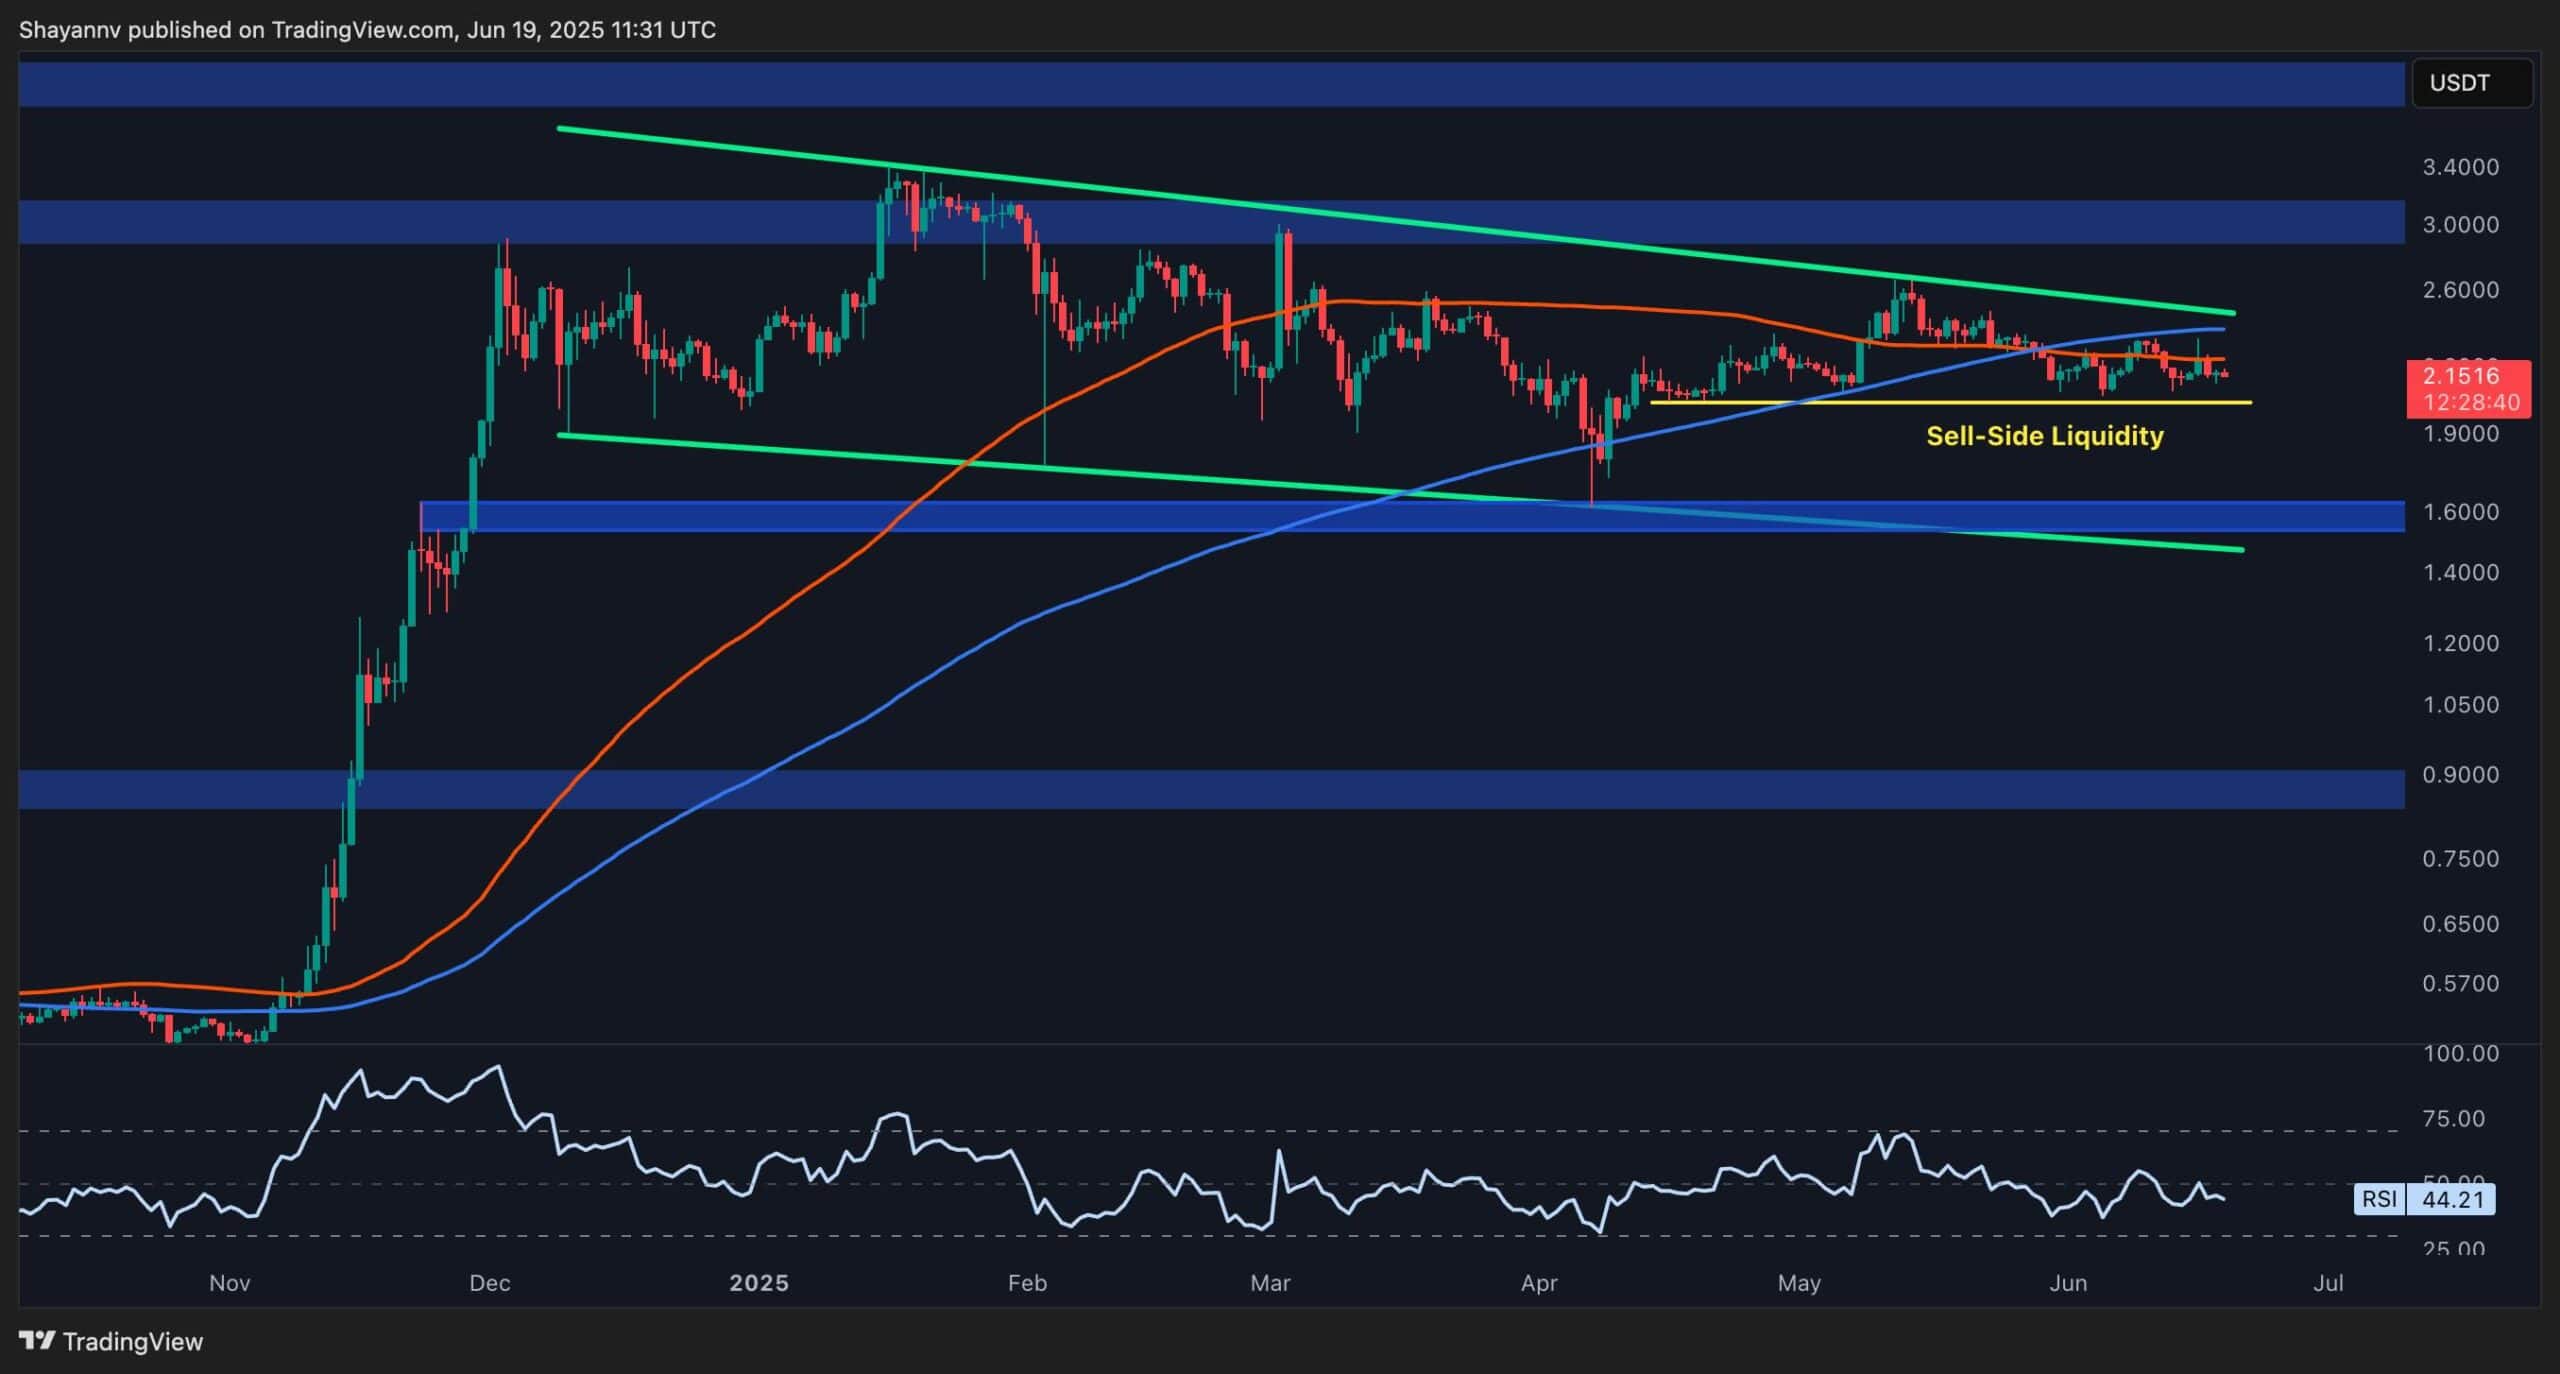
On the daily chart, XRP/USDT remains compressed within a long-term descending channel pattern, bounded by a descending trendline from the yearly highs and a horizontal support near $1.95, with tons of sell-side liquidity resting under it.
The pair is currently trading around $2.15, just under both the 100 and 200 moving averages. The RSI is also hovering near 44, indicating the lack of momentum and confirming the range-bound behavior. The asset is currently coiling just above the highlighted liquidity level, suggesting that if sellers manage to breach $1.95, the next logical demand zone lies around $1.6.
Meanwhile, upside resistance remains at the upper bound of the channel near $2.60, which has rejected multiple attempts in recent weeks. A clean break and daily close above that trendline would potentially confirm a bullish rally, with the target being around $3. Until then, this is still a neutral structure favoring range traders rather than trend-followers.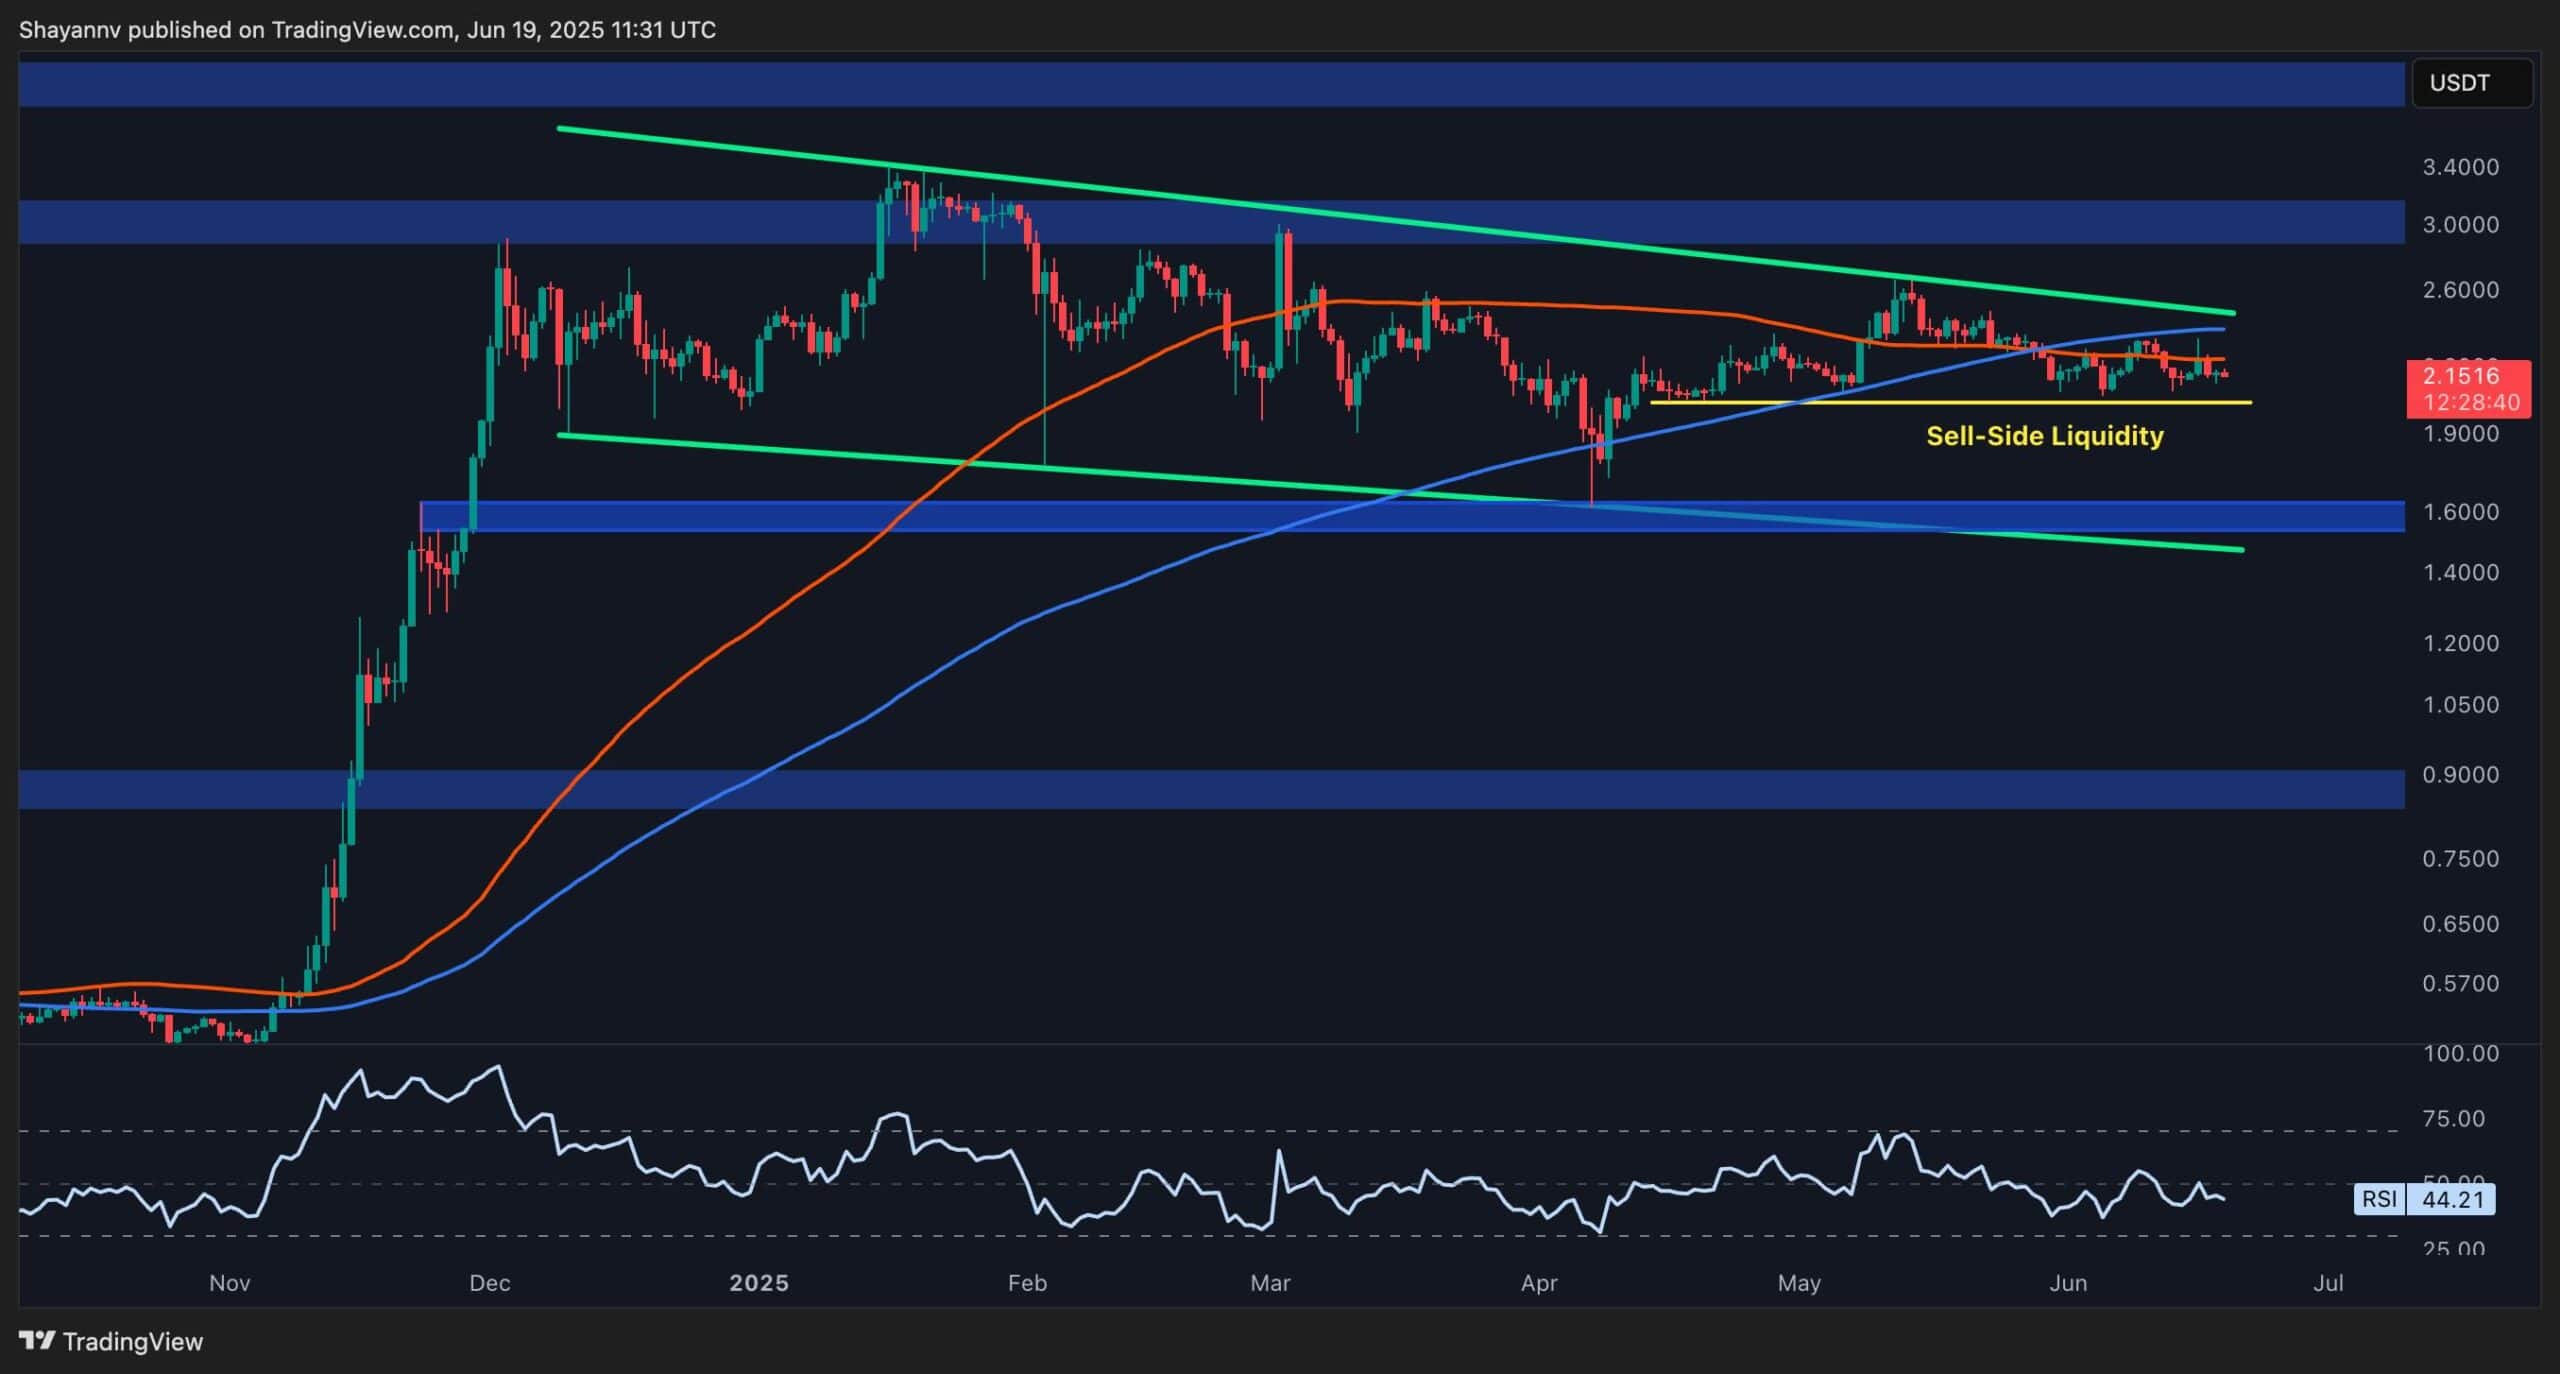
The BTC Pair
Against Bitcoin, XRP has shown persistent weakness since March, consistently printing lower highs and lower lows. The chart highlights a large descending wedge formation, with price now moving toward the lower boundary of the pattern. Both the 100 and 200 moving averages are angled downward after a bearish crossover, and the RSI is still depressed near 42, reflecting ongoing relative underperformance.
That said, the pair is approaching the imbalance zone (FVG) left from the explosive rally in late 2024. This pocket, located just below 1900 SAT, could act as a magnet for price while also offering potential for a relief bounce. If the buyers step in, the first challenge lies near the higher trendline of the wedge around 2200 SAT, which coincides with a horizontal resistance level.
A decisive move above that level could shift short-term momentum, but unless that happens, the pair remains locked in a clear bearish structure.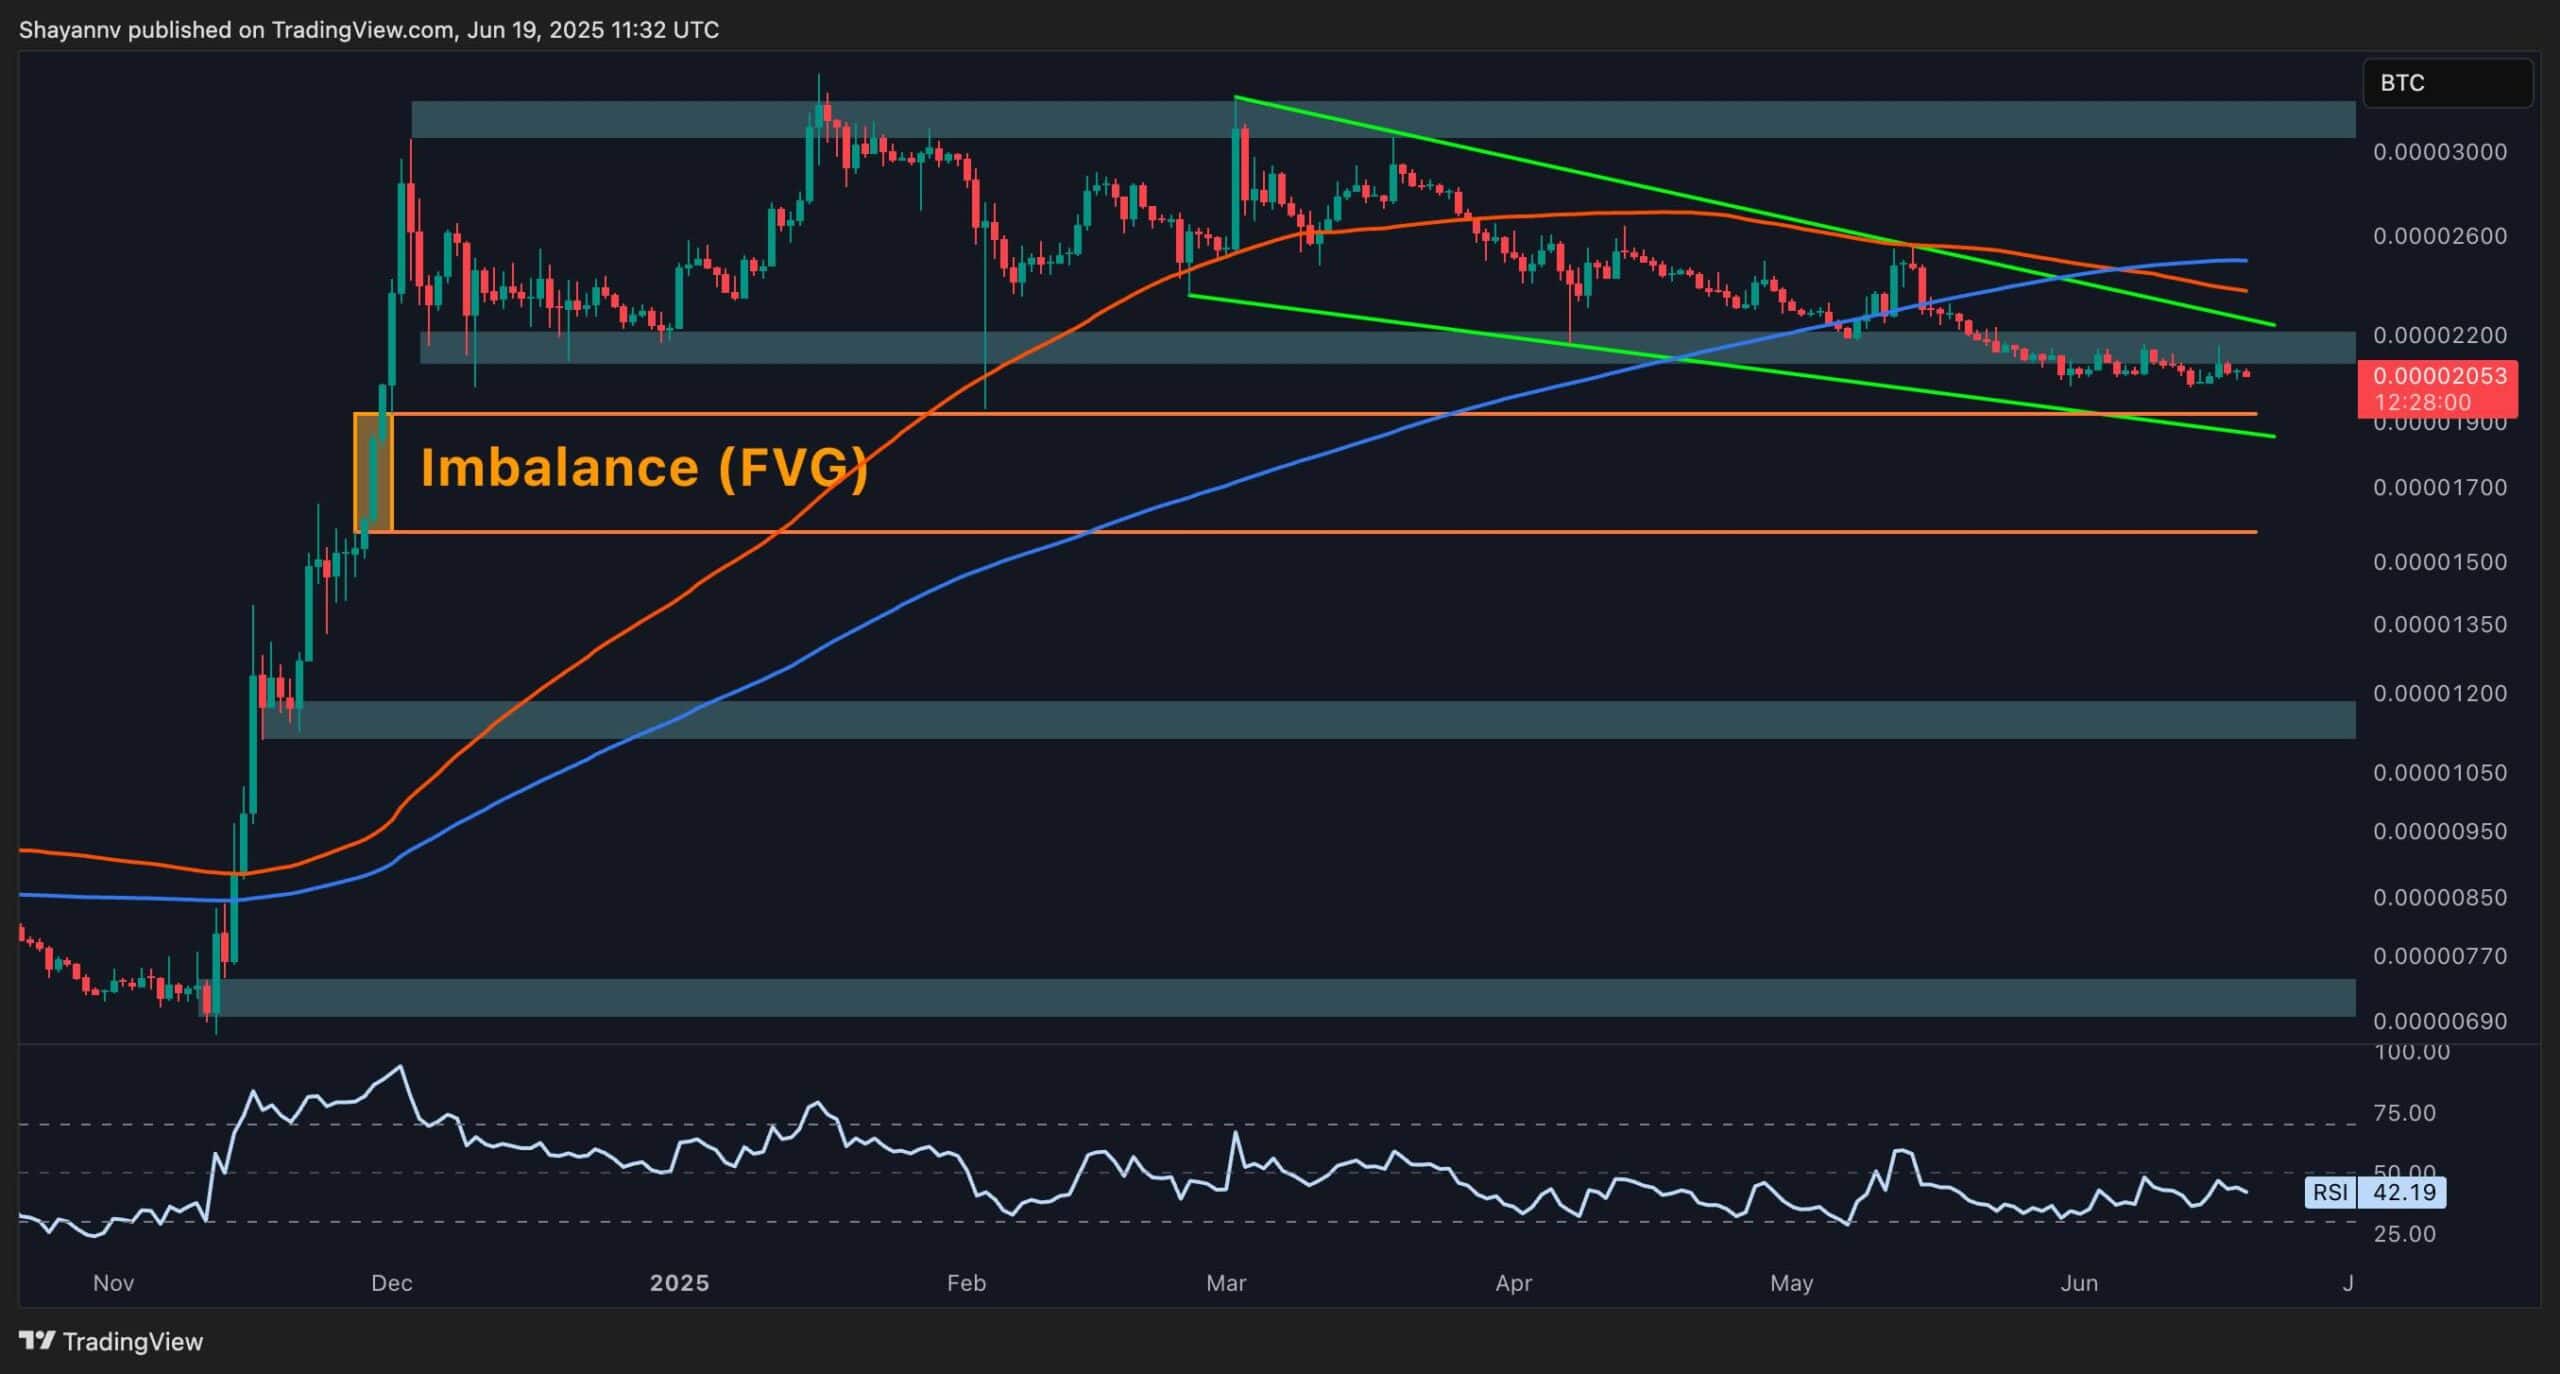
The post Ripple Price Analysis: XRP Nears Inflection Point, What’s Next? appeared first on CryptoPotato.