Why Crypto Is Dropping: Is The Bitcoin Run Over?
The crypto market has been in the red today with Bitcoin taking altcoins down with it. The main reason could be the Trump and China thing on tariffs and taxes. It is also affecting the S&P500, Nasdaq (US100) and DJI indexes. Actually all three are having their biggest red day in a while. In the meantime, Gold and Silver are doing well. This shows us that Bitcoin is more tied to the indexes rather than safe-haven assets like Silver and Gold. Partially meaning we are still early with
![]() Bitcoin 7.45%
Bitcoin 7.45% ![]() Bitcoin BTC Price $112,341.58 7.45% /24h Volume in 24h $142.85B Price 7d .
Bitcoin BTC Price $112,341.58 7.45% /24h Volume in 24h $142.85B Price 7d .
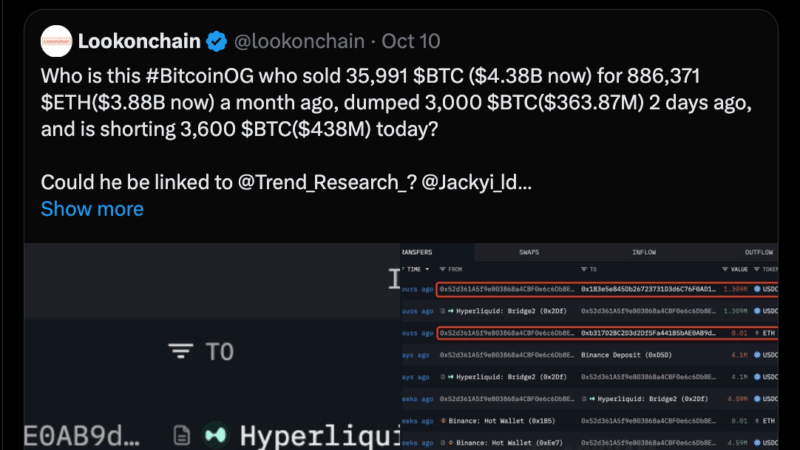
We form a higher low in the grey box or we go sub $100k.
That's the trade for me.
Either scale in or use the LTF for your entry. https://t.co/B1xM84GCtg pic.twitter.com/TgBPhCZR0a
— Mayne (@Tradermayne) October 10, 2025
Interesting takes both from Ponzi and Mayne. It is good to hear thoughts from both seasoned traders. Mayne gave very broad but clear levels to look at how price reacts from very large boxes, though there is not much to change because it all depends on volatility.
DISCOVER: Best Meme Coin ICOs to Invest in 2025
Bitcoin Dead? Is The Cycle Over Or Not Yet?
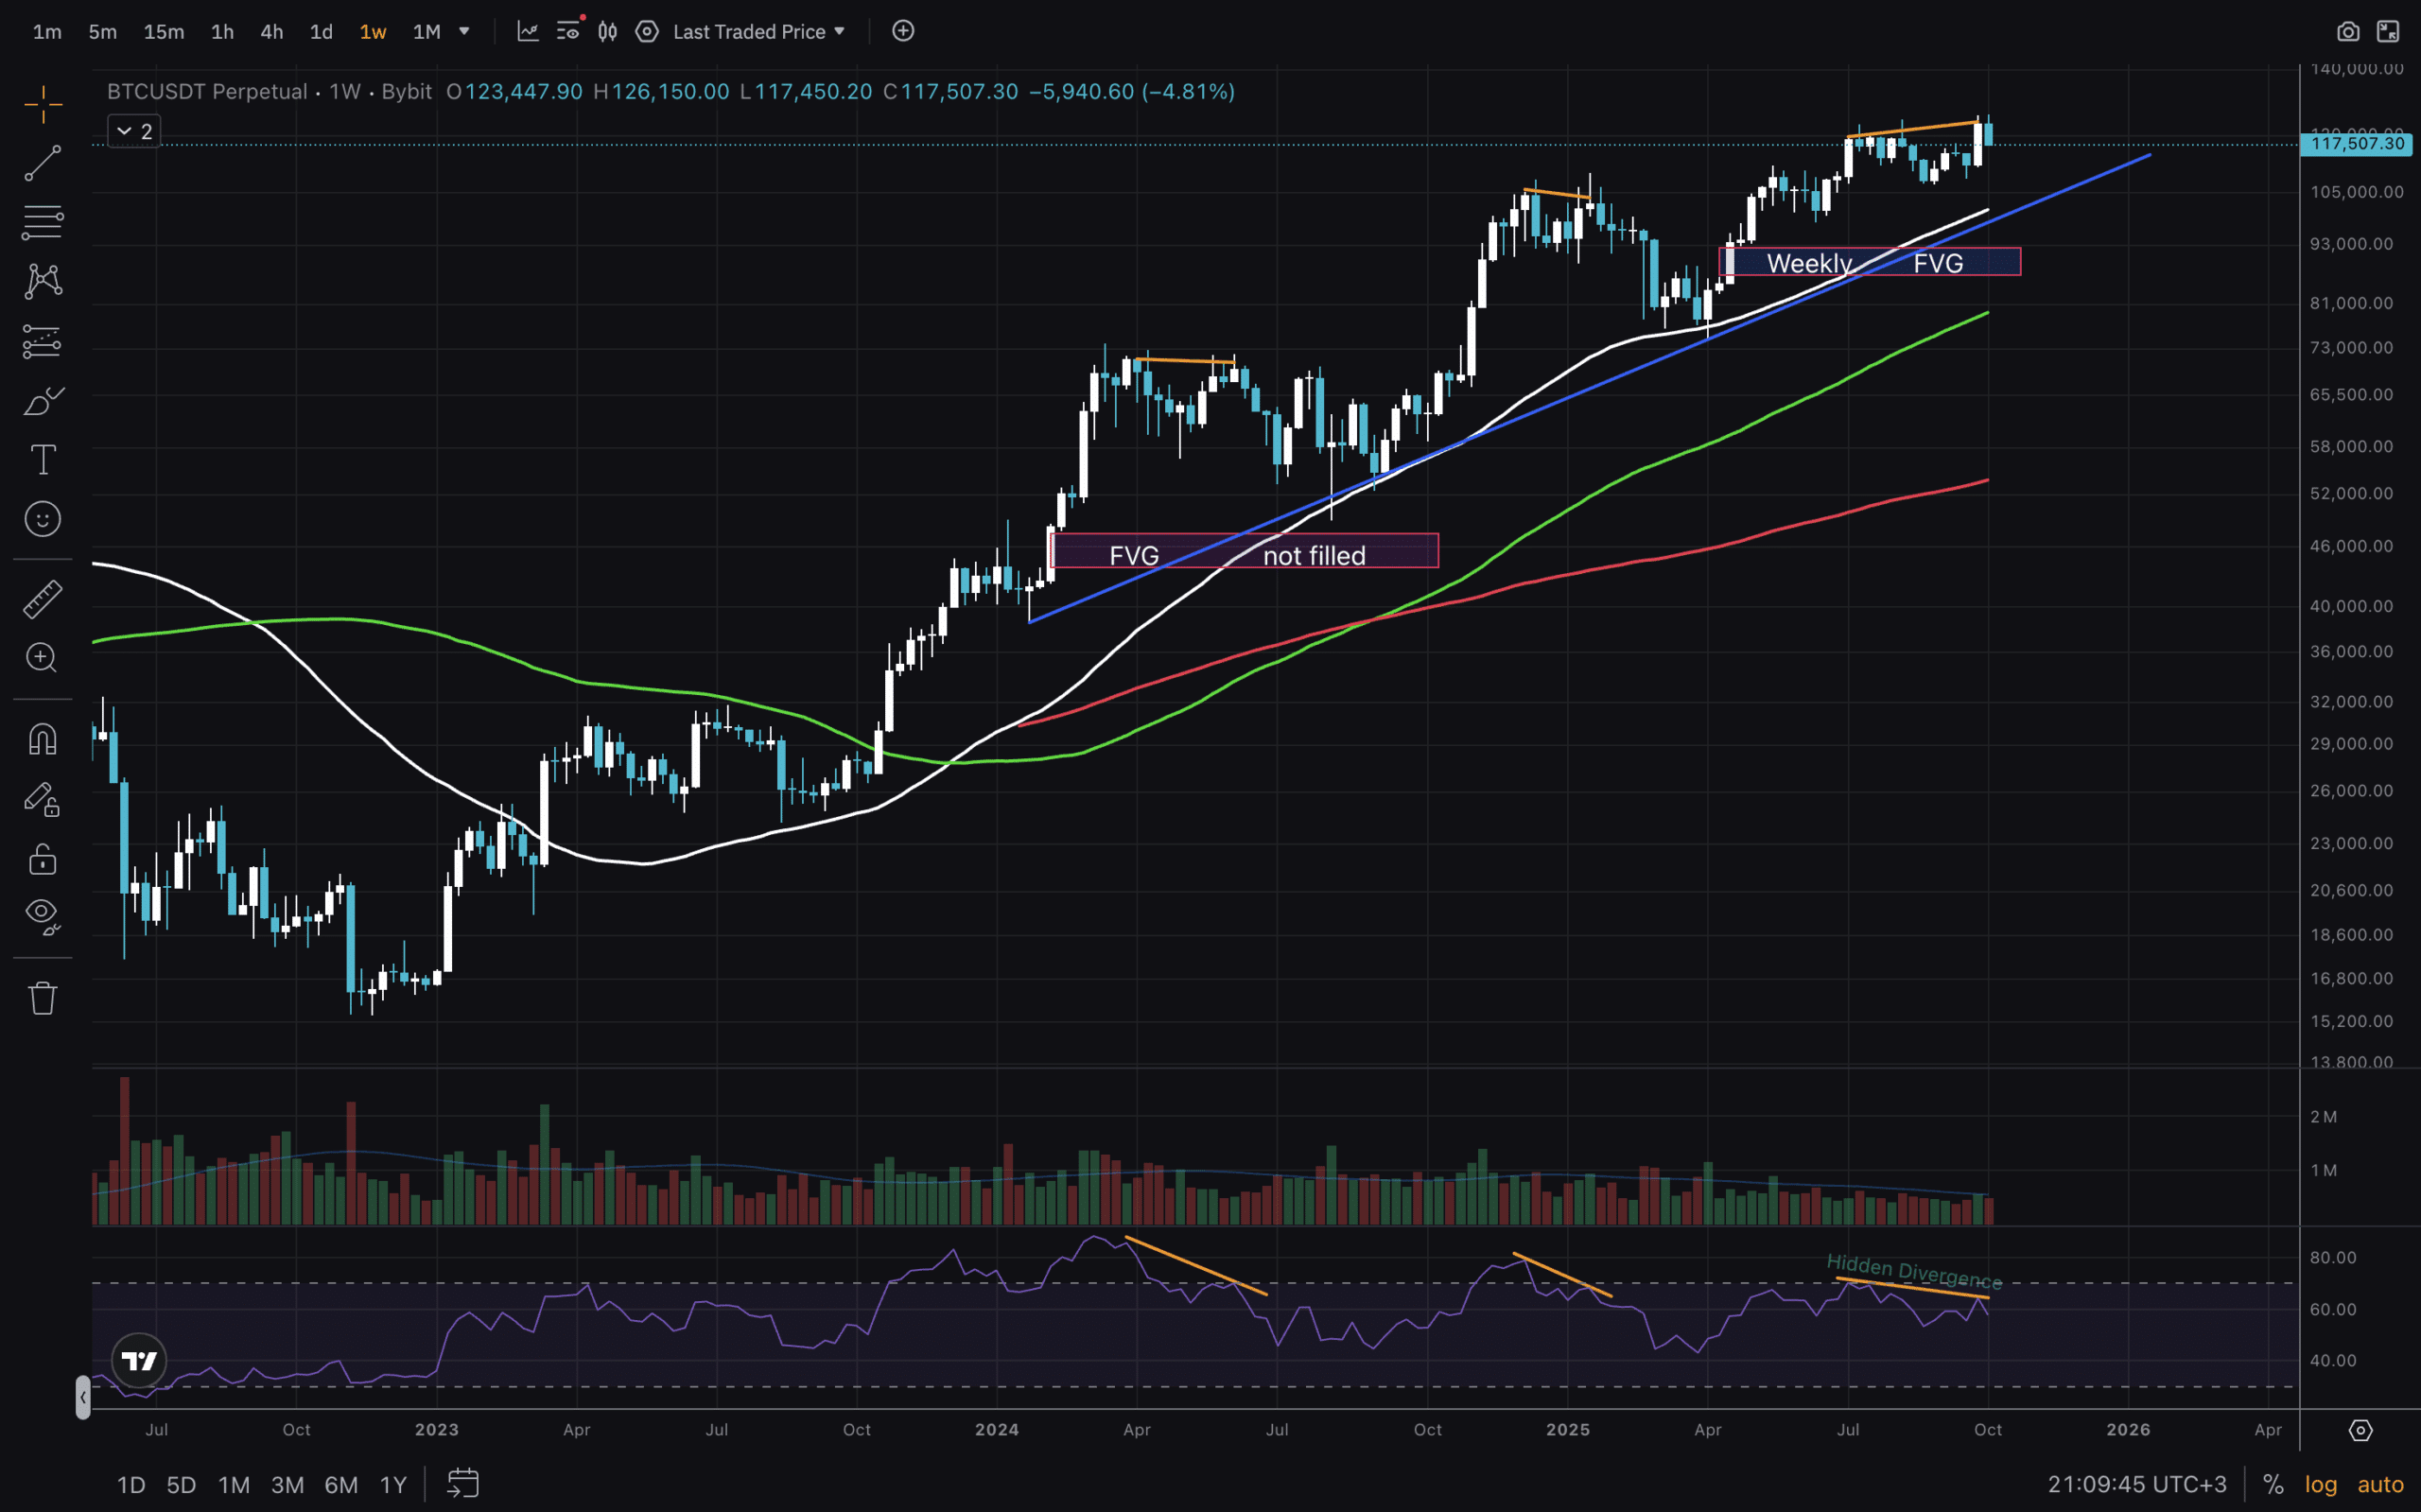
(Source – Tradingview, BTCUSD)
Well, it is hard to say “Bitcoin is dead” when one looks at the Weekly chart. One would rather say that Bitcoin has been on a nearly 3-year-long uptrend. Very impressive if you think about it! There are three RSI hidden bearish divergences, where price went sideways, or on the last one, a little higher, but RSI dropped. Other than that, in this timeframe, we have all the Moving Averages in an uptrend formation and the blue 2-year uptrend line. There is also an FVG gap that might get filled after all, if price dips so low. It’s a bid area if it does!
DISCOVER: Top Solana Meme Coins to Buy in 2025
(Source – Tradingview, BTCUSD)
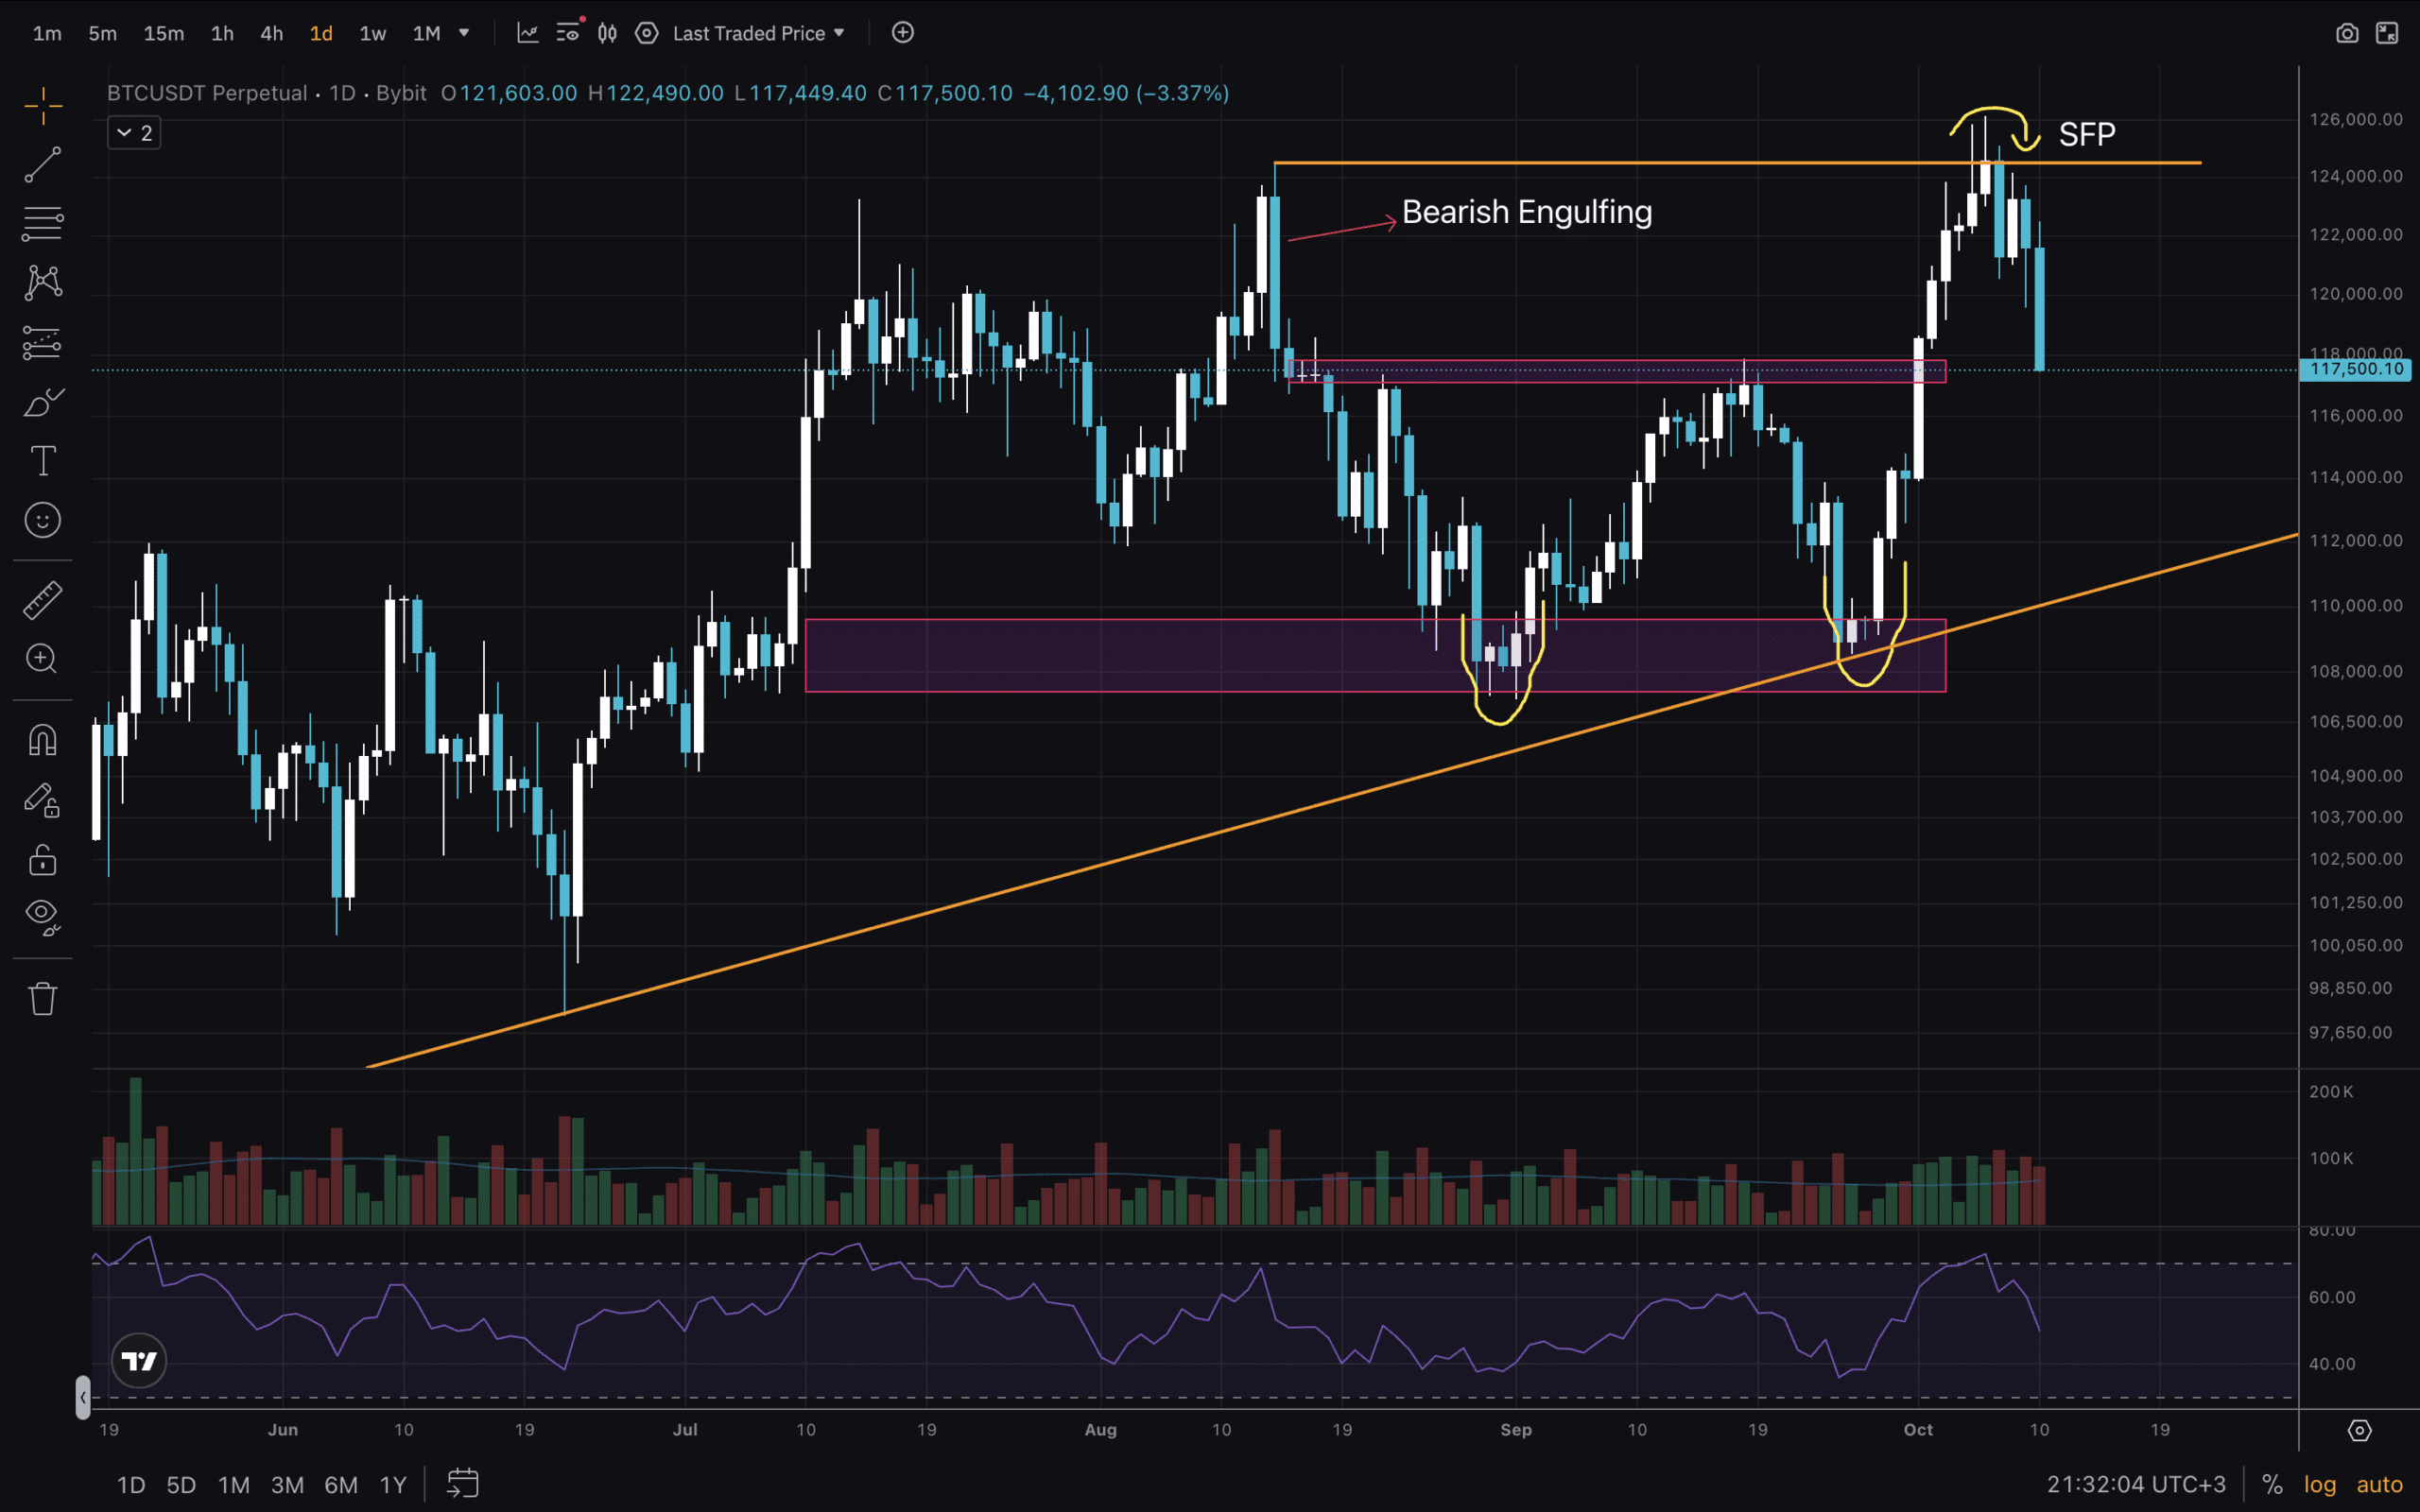
Next, we analyse the 1D timeframe. We have another uptrend line (orange) that started in June this year. Also, we have two order blocks that had reactions from. And in August, we had a strong Bearish Engulfing candle. And a couple of days ago, we had an SFP. If you look at each candle and its volume, it is fair to say that there has been selling pressure all throughout late July until today. RSI is moving down quickly, but it does not tell us how far price will drop.
Low Timeframe Insights And Concluding Thoughts
(Source – Tradingview, BTCUSD)
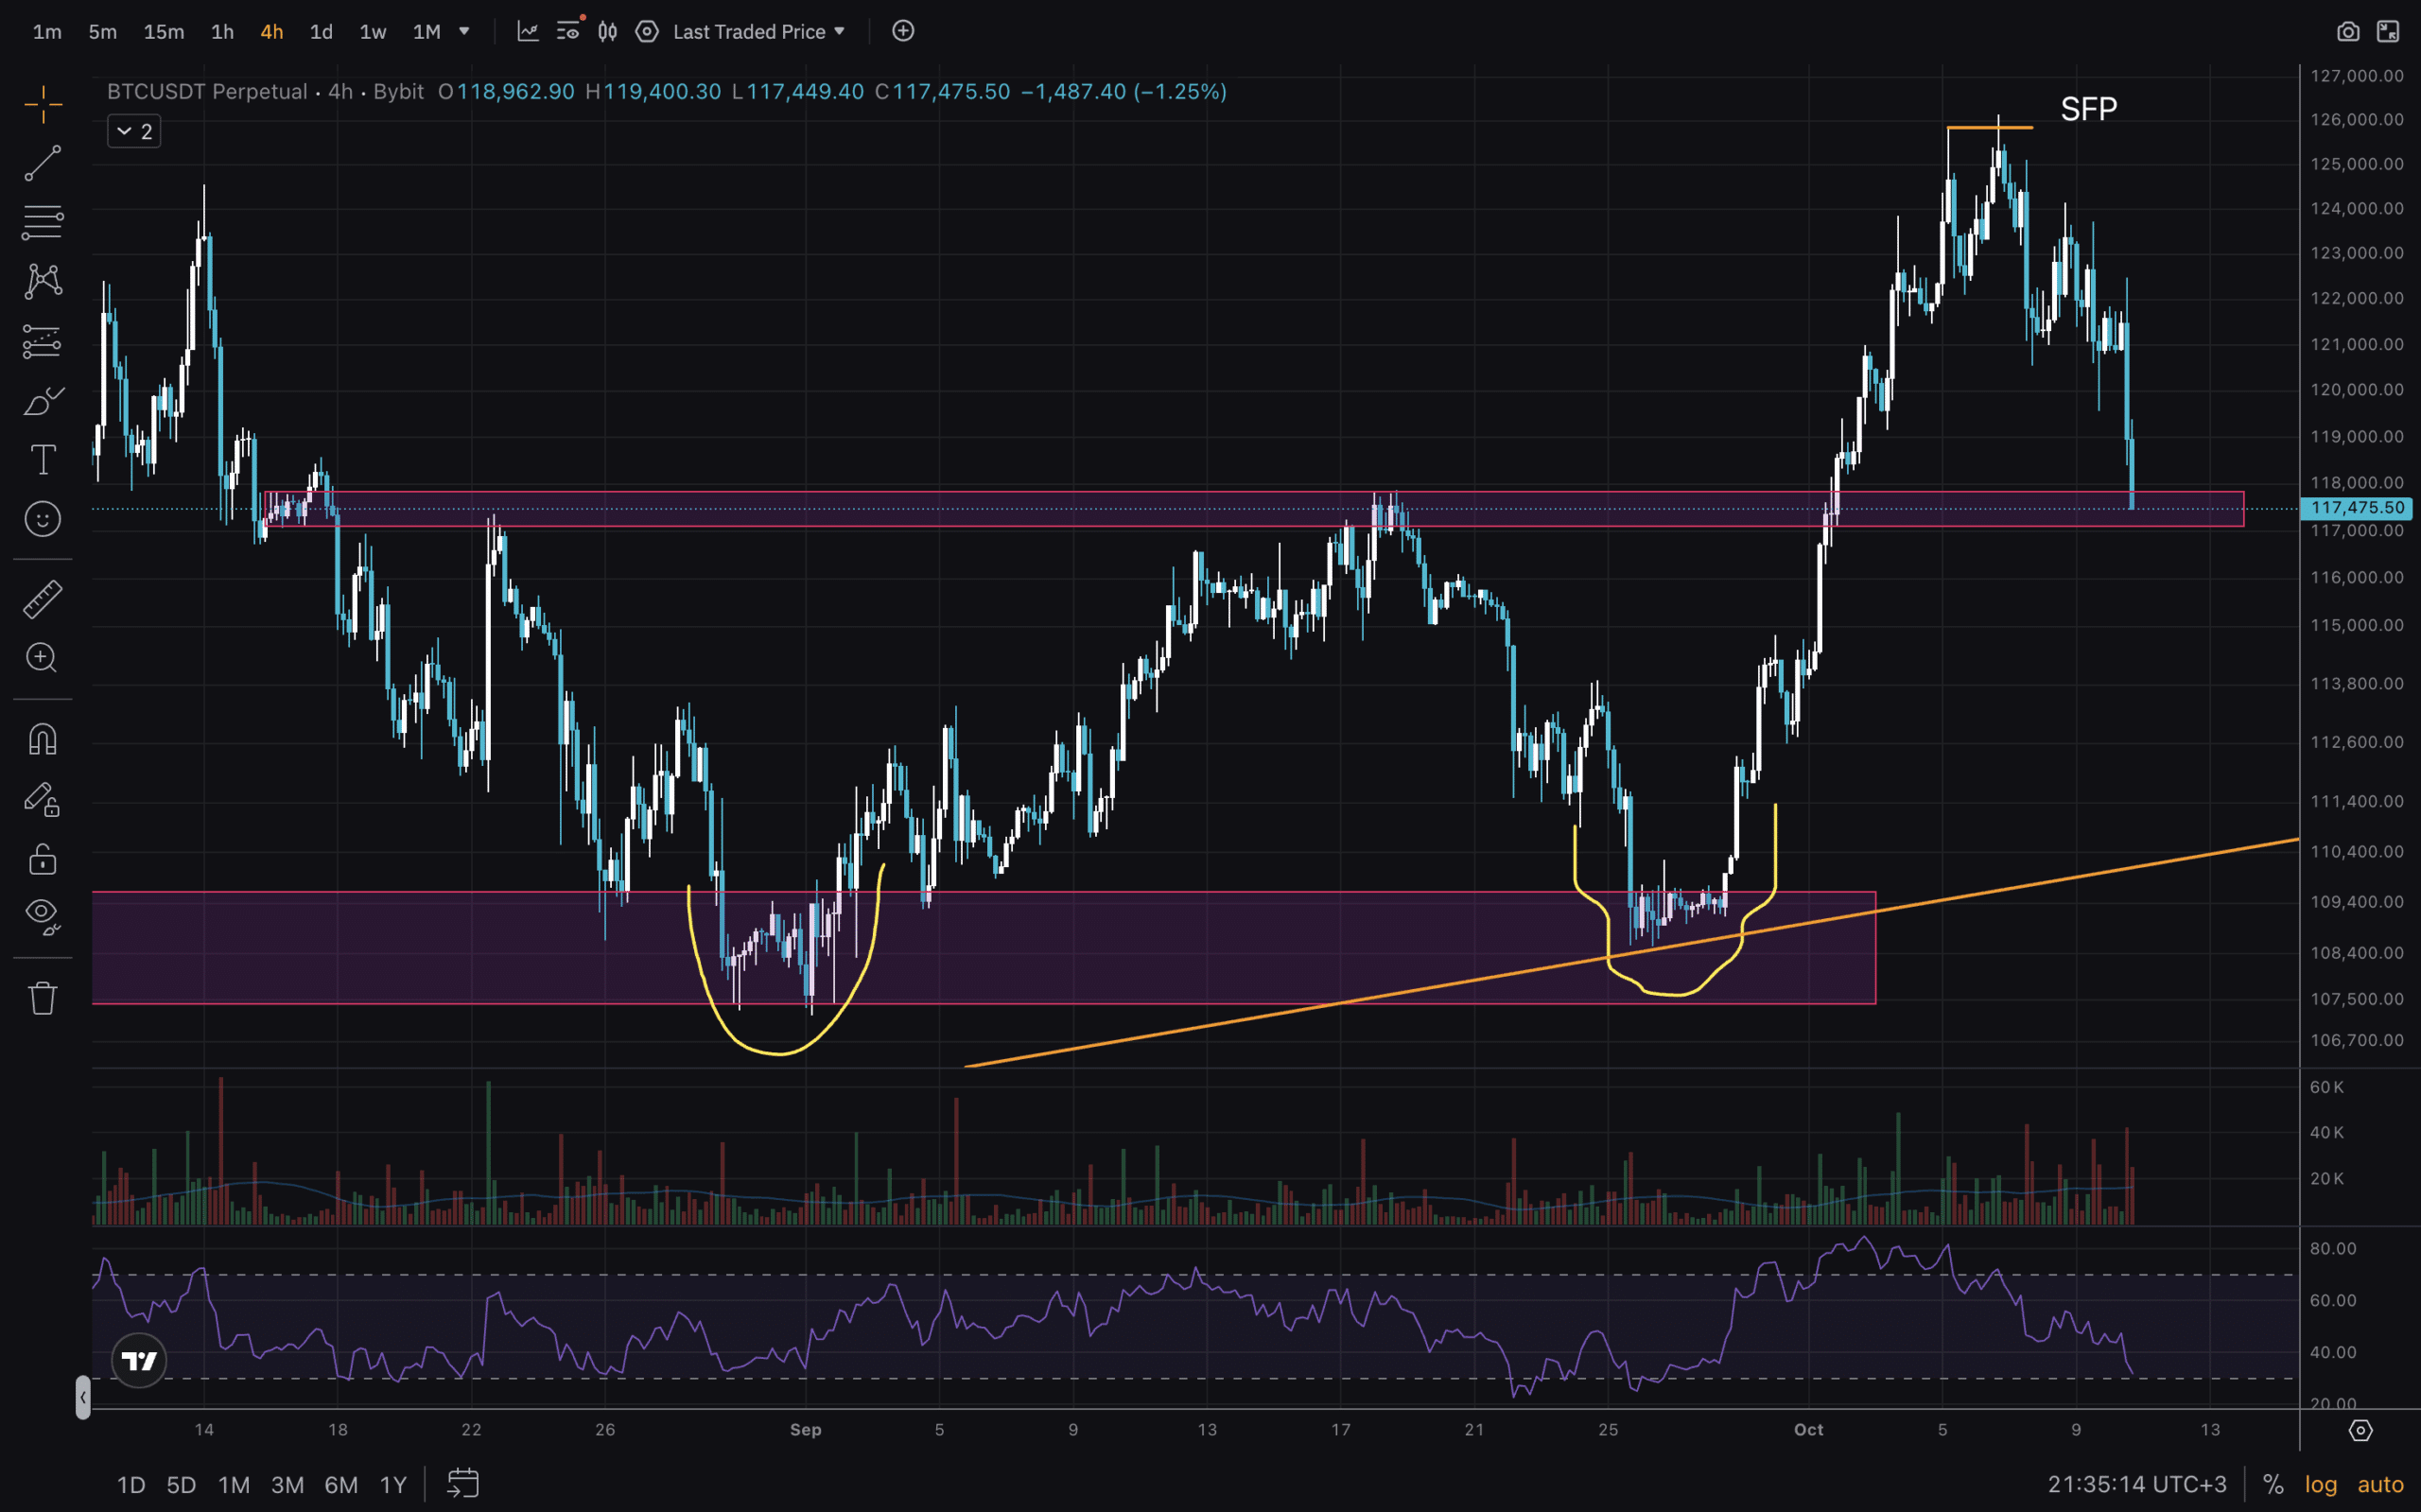
The last chart for this article is on the 4H timeframe. The $117,000-$118,000 order block could be a potential support here. RSI is almost at oversold, though the trendline is still another $7,000 down. Will that be our next support? Or maybe another liquidity grab at $107,000-$110,000 order block? One bullish thing here is that we have a higher high. As long as the next low is above $110,000, bulls can breathe. If it drops below, bears are taking control.
Not much to do right now except stand on the side and watch. It makes sense that people are taking profit after BTC pulled an almost 700% increase over the past 3 years. It would be foolish not to. Not the top for now.
This can be the time when capital starts to rotate into major alts like ETH, SOL, etc… Good to keep an eye out for how they perform against BTC.
Stay safe out there!
DISCOVER: Top 20 Crypto to Buy in 2025
Join The 99Bitcoins News Discord Here For The Latest Market Updates
Why Is Crypto Dropping: Is The Bitcoin Run Over?
- First Key level to hold is $117,000, and Second $110,000
- 1D chart shows bearish factors, yet structure remains bullish
- Weekly FVG at $86,000-$92,000 zone. Will it get filled?
- Key level to break for upward continuation is $124,000.
The post Why Crypto Is Dropping: Is The Bitcoin Run Over? appeared first on 99Bitcoins.