BTC Holds Key Support: How High Can Bitcoin Go Next?

Bitcoin (BTC) is showing signs of strength after bouncing from key support levels and closing back above a historically important resistance line. The current recovery follows a sharp move down at the end of the previous week, with traders now watching whether BTC can reclaim higher levels and extend the move toward $117,000.
Recent price action shows the market reacting at well-established technical zones. Analysts are tracking these levels as bitcoin continues to trade within a defined range.
Price Reclaims Support, Tests Resistance
Bitcoin rebounded from a higher low near $110,000 (on most exchanges), a level marked in purple on the daily chart shared by Rekt Capital. This same line was the base for previous reversals. BTC has now closed a daily candle above ~$114,300, which has historically served as a strong resistance. In the last five cases where bitcoin closed above this level after bouncing from the higher low, it moved toward $117,300.
Bitcoin has rebounded from the very same Higher Low (purple) from which the previous reversal originated from
More, $BTC has Daily Closed above ~$114.300 (black)
On the previous 5 times this has happened, Bitcoin rallied to at least ~$117,300 (blue)#Crypto #Bitcoin pic.twitter.com/AOvveB5i68
— Rekt Capital (@rektcapital) October 13, 2025
Rekt Capital notes that the $117,300 level may again act as the next target. The chart shows repeated reactions around this zone, while $123,000 remains the upper resistance, where past rallies have slowed down. Green and red circles on the chart indicate the areas of past bounces and rejections.
Technical Indicators Show Recovery Potential
The daily RSI has formed a bullish divergence. While the price made higher lows, RSI made lower lows, suggesting momentum may be turning. The RSI is now rising out of oversold territory, which supports the case for further strength.
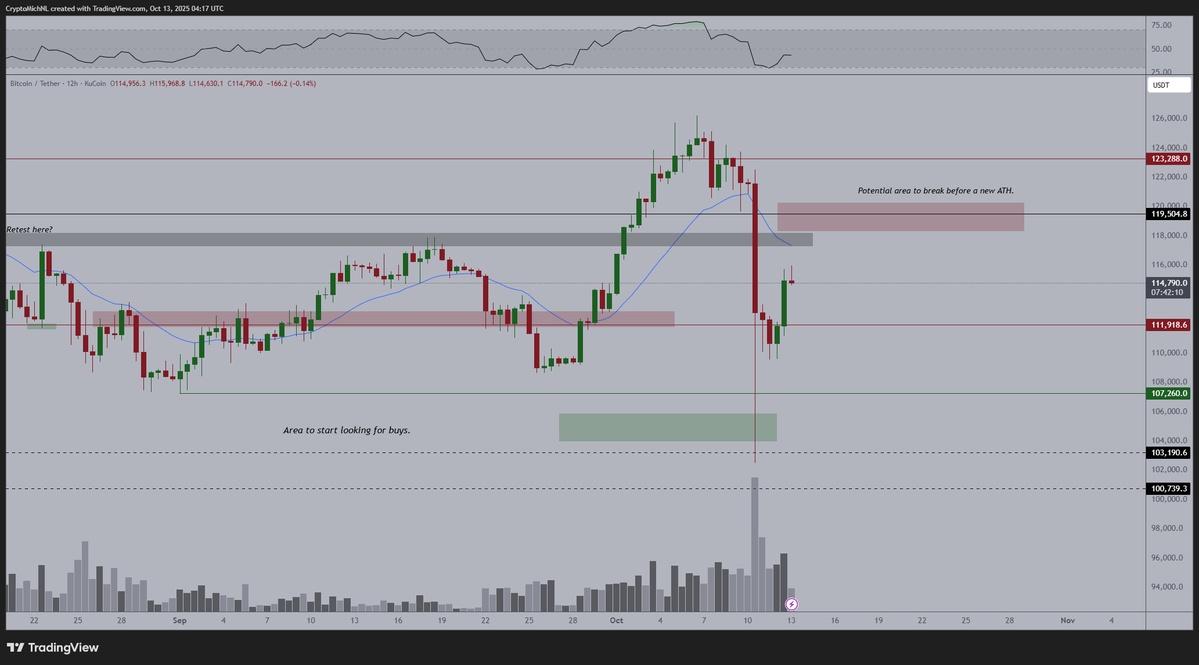
A new CME gap between $115,690 and $116,865 has formed, while the previous one between $109,700 and $111,310 was revisited by the spot price. Though the CME futures chart technically didn’t fill the gap, Rekt Capital commented, “Price obviously revisited that CME Gap price area over the weekend,” suggesting the practical relevance of the zone.
Weekly Structure Maintains Bullish Trend
On the weekly chart, BTC continues to hold above the 21-week EMA, a level that has supported higher candle-bodied lows across the year. Rekt Capital marked past reactions where this EMA acted as a base for upward continuation. Bitcoin’s latest bounce has once again respected this moving average, now sitting near $115,578.
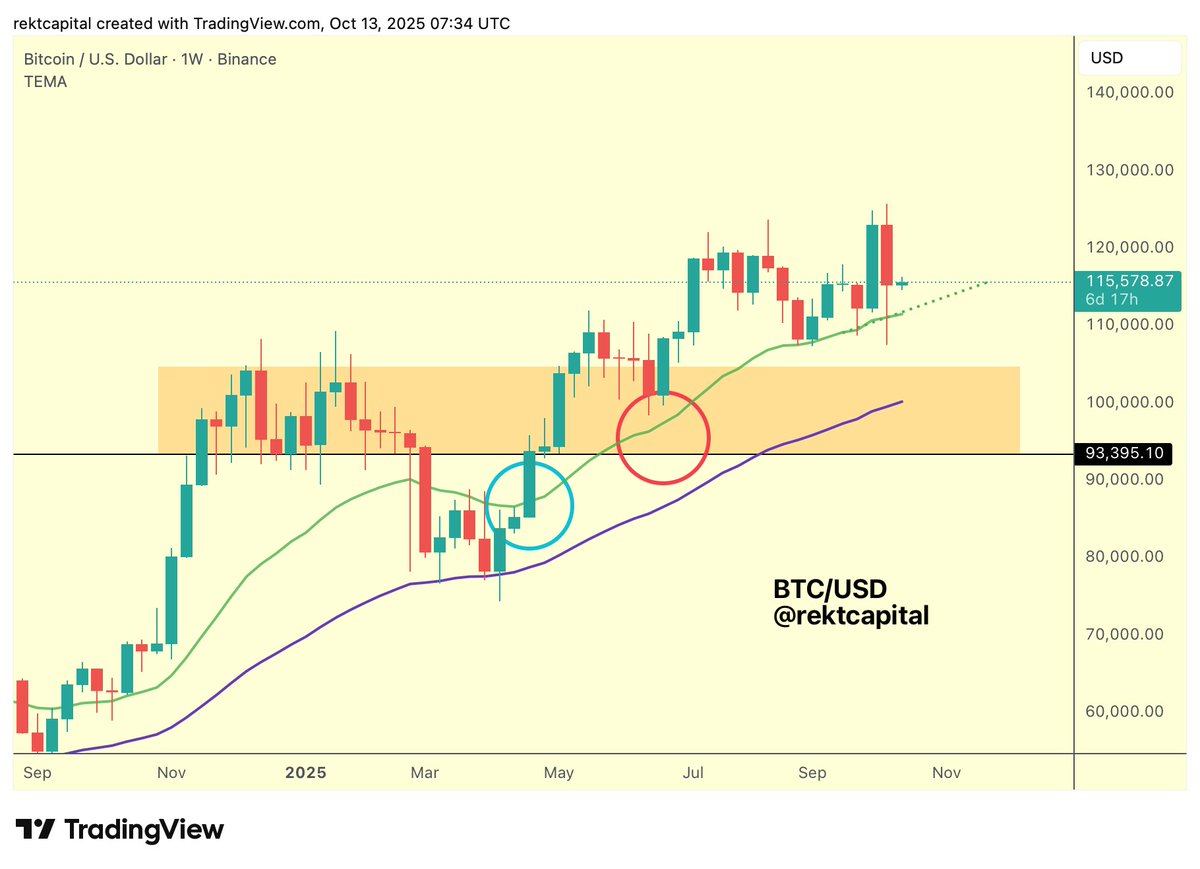
Notably, the structure remains consistent with previous bullish phases, with the price forming higher lows on each pullback. As long as BTC stays above the 21-week EMA and recent support zones, the trend remains intact.
$120K Remains Key Resistance Before New Highs
Michaël van de Poppe shared that BTC needs to clear the $119,500–$120,000 zone to continue higher.
“The area around $120K should break in order to have momentum upwards,” he said.
He also named $112,000 as the key support area. That level held during this week’s pullback before buyers stepped in.
With $112K as support and $120K as resistance, bitcoin is moving within a clear range. A strong breakout above $120K may open the door for a new all-time high.
The post BTC Holds Key Support: How High Can Bitcoin Go Next? appeared first on CryptoPotato.