RENDER Price Prediction 2025: How Far Can RENDER Rally If $4.19 Flips?


The post RENDER Price Prediction 2025: How Far Can RENDER Rally If $4.19 Flips? appeared first on Coinpedia Fintech News
The RENDER price prediction 2025 narrative is heating up rapidly as Render Network tests a crucial make-or-break support zone. With the project continuing on Solana after migrating from ETH, its on-chain activity is quite holding up. This month’s market structure shows early signs of a potential breakout that could fuel a major rally into late 2025 and early 2026.
Render’s Solana Expansion Sparks Unusual Transfer Momentum
Render Network’s migration to Solana continues to inject strength into RENDER crypto. The shift, designed to benefit from Solana’s speed and low-cost execution, has accelerated network usage meaningfully this month.
According to SOLSCAN, RENDER token transfers jumped from 7,339 on November 2 (worth $4.25M) to an impressive 48,074 transfers worth $50.79M when writing. This surge represents a powerful expansion in network activity and confirms rising engagement with Solana-based RENDER tokens.
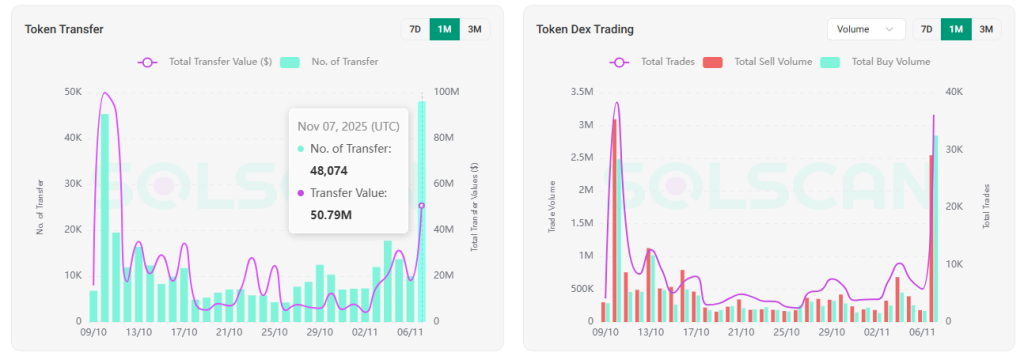
Similarly, DEX trading volumes are rising aggressively. Total trades shot up to 36,132 from this week’s low of 3,948, while buy volume has overtaken sell volume. When writing SOLSCAN showed Buy volume at $2.84 million and Sell volume at $2.54 million respectively.
This shift suggests that bears are beginning to lose control and a short squeeze may emerge if buyers dominate the order flow.
Liquidity Clusters Point Toward a Rapid Upside Path
Moreover, the Coinglass liquidity heatmap chart show two key liquidity clusters that could act as magnets ahead for RENDER/USD.
First is $3.75 that has an 680.32k in liquidation leverage the second is at $4.19 that has 833.57k in liquidation leverage.
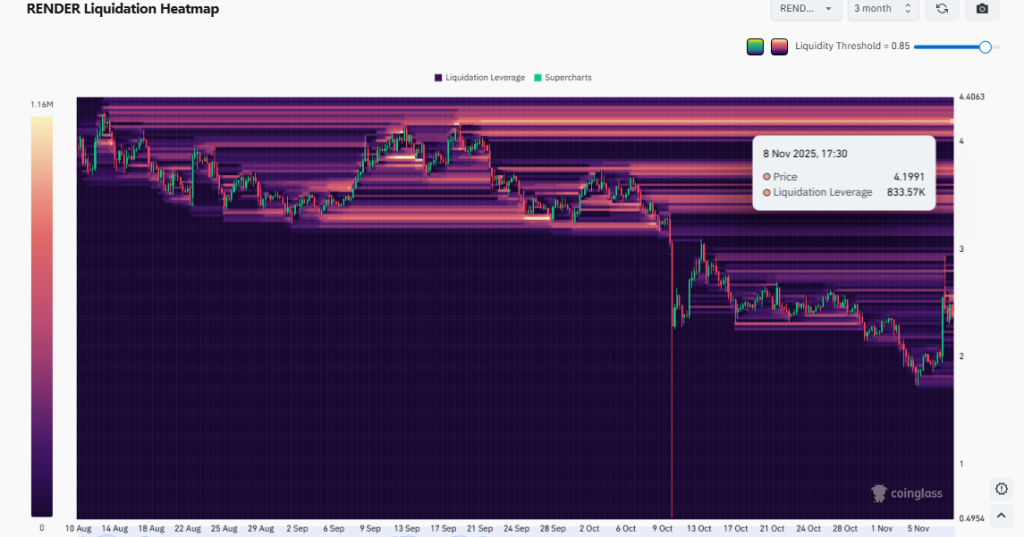
If bullish demand strengthens, prices often move toward these liquidity pools, accelerating upside movement.
The RENDER price chart aligns with this outlook. The weekly pattern shows a broad downward wedge shaping price action since 2024, with current support holding around $2.00–$2.50, which is deemed as a historically valuable zone.
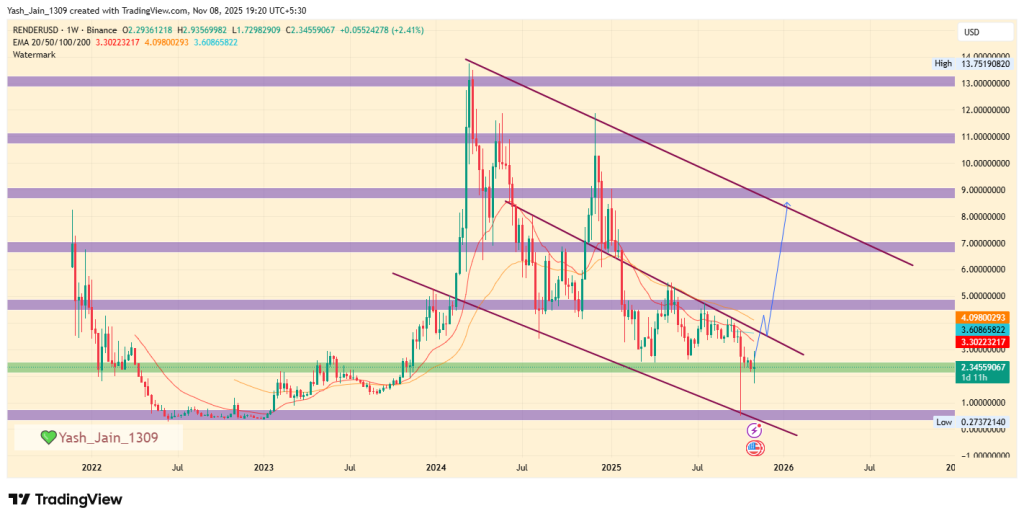
Should $4.19 flip with momentum, Render could target $9 before year end, with potential to revisit $13.75 in early 2026, reflecting the wedge breakout measured move.
Technical Indicators Show Early Accumulation Despite Mixed Momentum
Additionally, its technical indicators still suggest a cooling phase on RENDER price USD, as RSI at 36.63 indicates oversold conditions may deepen toward 30.
MACD and AO remain muted, hinting at ongoing consolidation. However, the Chaikin Money Flow (CMF) at 0.09 shows increasing positive inflows, signaling accumulation beneath the surface.
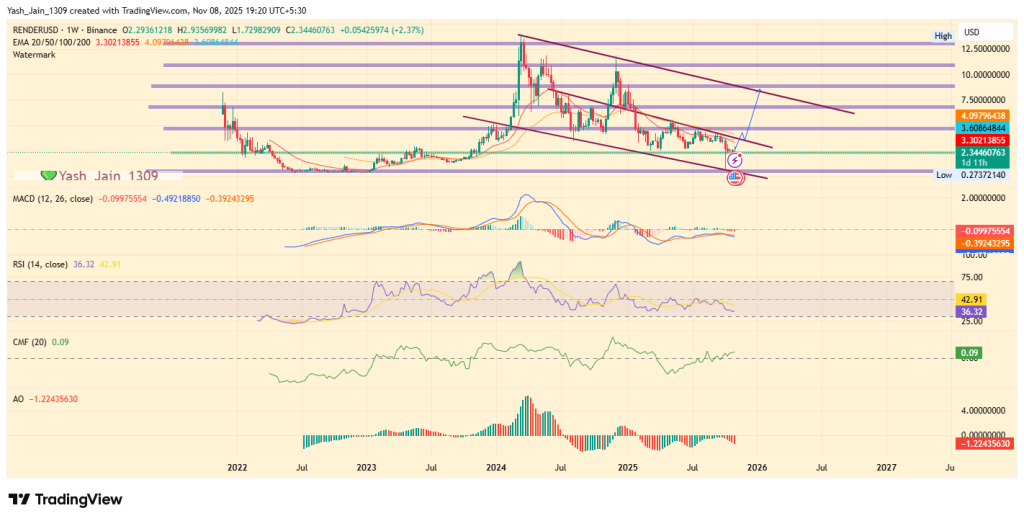
These conditions often precede sharp rallies once supply thins and demand surges.
As market volume builds and RENDER holds its critical support, the RENDER price prediction 2025 outlook shows growing potential for a strong continuation rally.