Bitcoin Price Backs Off Resistance — Breakdown Or Brief Pause?
Bitcoin price started a recovery wave above $89,500 but failed above $90,000. BTC is declining and might dip further if it breaks $88,000.
- Bitcoin failed to remain above $90,000 and started another decline.
- The price is trading above $88,200 and the 100 hourly simple moving average.
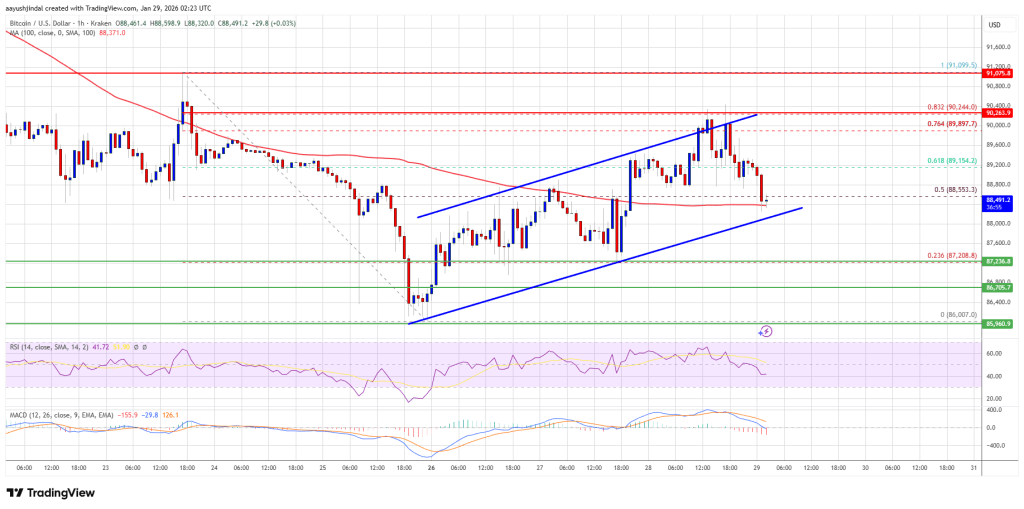
- There is a rising channel forming with support at $88,100 on the hourly chart of the BTC/USD pair (data feed from Kraken).
- The pair might dip further if it trades below the $88,000 and $87,500 levels.
Bitcoin Price Faces Rejection
Bitcoin price remained stable above the $88,000 support. BTC formed a base and recently started a recovery wave above the $88,500 level.
The price climbed above the $89,000 and $89,500 levels. There was a move above the 76.4% Fib retracement level of the downward move from the $91,098 swing high to the $86,007 low. The bulls even pushed the price above $90,000 but they failed to keep the price in a positive zone.
There was a fresh decline below $89,000. Bitcoin is now trading above $88,200 and the 100 hourly simple moving average. Besides, there is a rising channel forming with support at $88,100 on the hourly chart of the BTC/USD pair.
If the price remains stable above $88,000, it could attempt a fresh increase. Immediate resistance is near the $89,150 level. The first key resistance is near the $89,800 level. A close above the $89,800 resistance might send the price further higher.
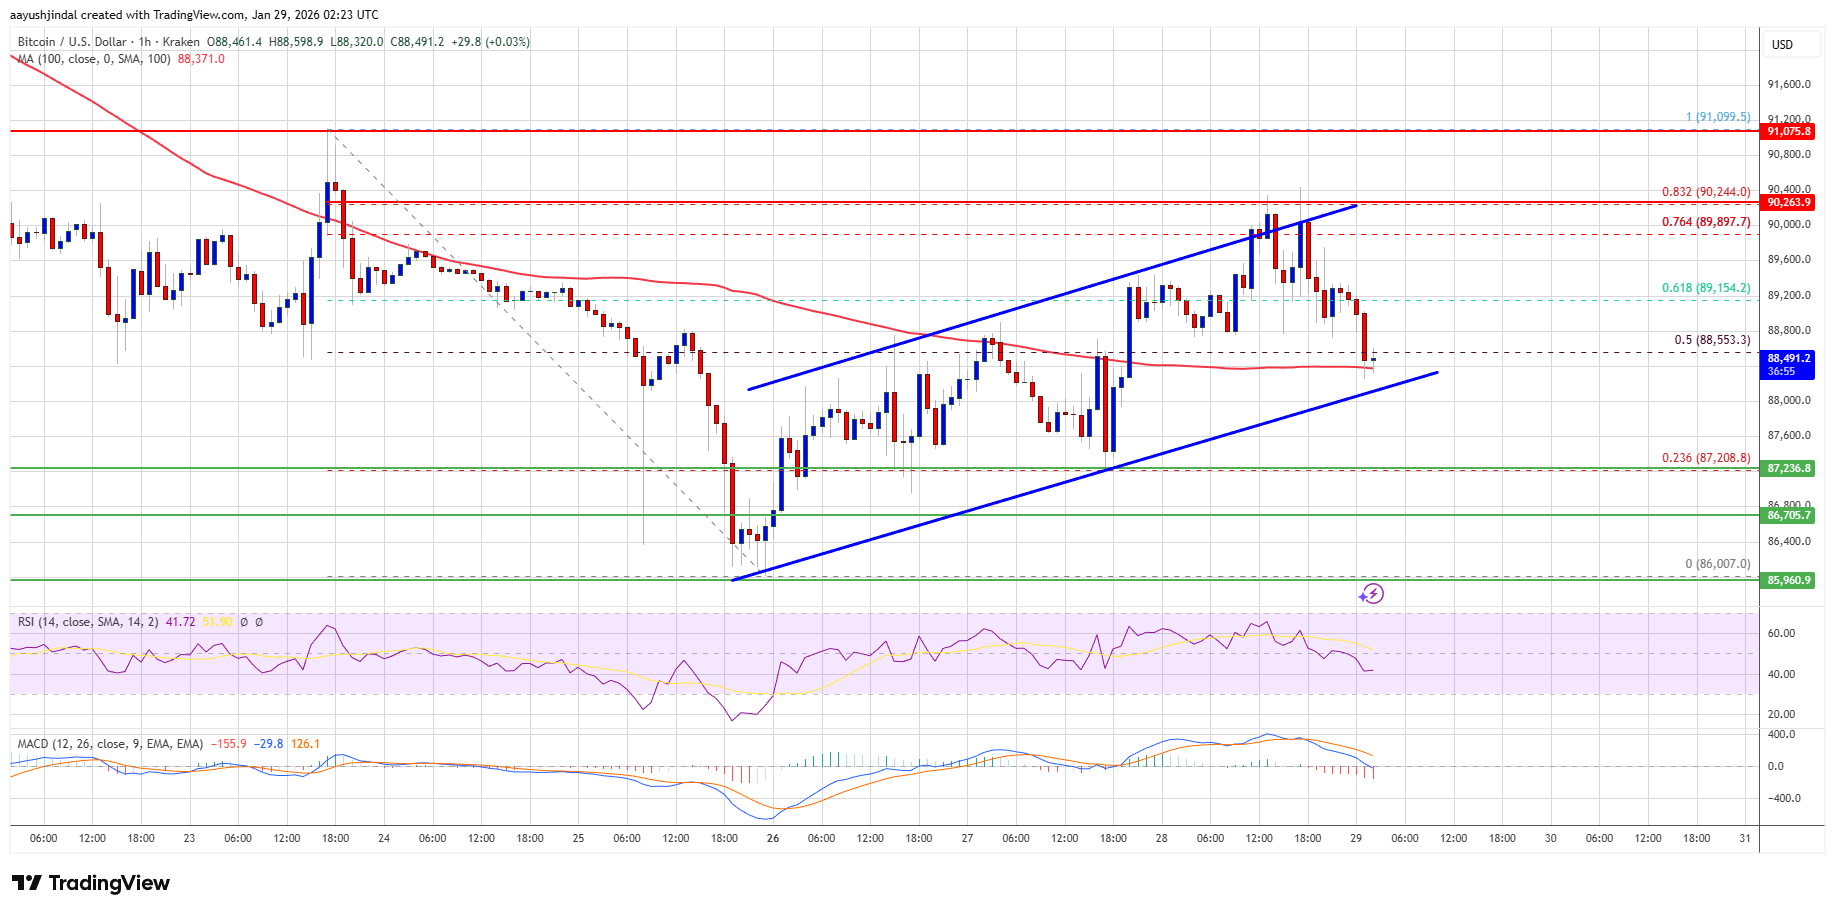
In the stated case, the price could rise and test the $90,250 resistance. Any more gains might send the price toward the $91,200 level. The next barrier for the bulls could be $92,000 and $92,500.
Another Rejection In BTC?
If Bitcoin fails to rise above the $89,150 resistance zone, it could start another decline. Immediate support is near the $88,200 level. The first major support is near the $88,000 level.
The next support is now near the $87,200 zone. Any more losses might send the price toward the $87,000 support in the near term. The main support sits at $86,000, below which BTC might struggle to recover in the near term.
Technical indicators:
Hourly MACD – The MACD is now gaining pace in the bearish zone.
Hourly RSI (Relative Strength Index) – The RSI for BTC/USD is now below the 50 level.
Major Support Levels – $88,200, followed by $87,000.
Major Resistance Levels – $89,150 and $89,800.