Chiliz Price Surges More Than 11%
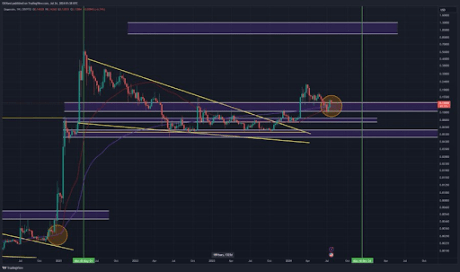
Chiliz price rallies towards north and is on the verge to smash the upper, strong resistance levels at $0.6. Previously, the price got rejected a couple of times and therefore, once the price breaks these levels, smashing ATH will be at the doorstep.

At the time of writing , the CHZ price is $0.5497 with a massive jump of 12.19% in the last 24 hours. The V-shape recovery indicates the asset is poised to spike and head towards the all-time high very soon. The RSI and MACD point out towards a bull rally, signaling a buy.
Technical Specifications
- The resistance level are currently at $0.6 and later at $0.7
- The support levels are at $0.47
- The indicators point out towards a strong buy signal
Enjin Coin(ENJ) Price Spikes 6.12%
The Enjin coin price broke through the ascending channel, rising high towards the next target close to $3.5. The price bounced above the 20-day MA and heading strongly towards the North with a strong bullish momentum.

The trading volume is required to increase a little to get a greater push for the price to rally high. At the time of writing, the ENJ price is $3.12 with a jump of 6.16% in the last 24 hours. The RSI is surging high and MACD, currently are neutral, may forecast a buy signal soon.
Technical Specifications
- The resistance levels are at $3.32
- The support levels are at $2.94
- The indicators point out towards a strong buy signal
Decentraland (MANA) Price Recovers
The MANA price just flipped the bearish divergence and initiated a recovery to gain the lost positions. The price appears to have consolidated well before a leg that could rally the price upwards. The ascending trend line was broken just a moment ago and the rally headed strongly towards the north.

At the press time, the MANA price is $1.13 with a jump of 5.29% in the last 24 hours after rallying more than 15% in the last 7 days. The RSI going upwards showcases a bullish trend. The MACD line just crossed the signal line to point out towards a buy signal.
Technical Specifications
- The resistance level is at $1.19
- The support level is at $1.07
- The indicators point out towards a buy signal


