Bitcoin Price Analysis: BTC Must Reclaim This Level in Order to Get Back on the Bullish Track
Bitcoin bounced by over $10K after yesterday’s bloodbath. After retesting support at $30K, it rebounded hours later and reached over $40K. Despite this, the primary cryptocurrency has seen a shaky week in which the price is down by over 20%. Is bitcoin in for recovery or is the bull market over?
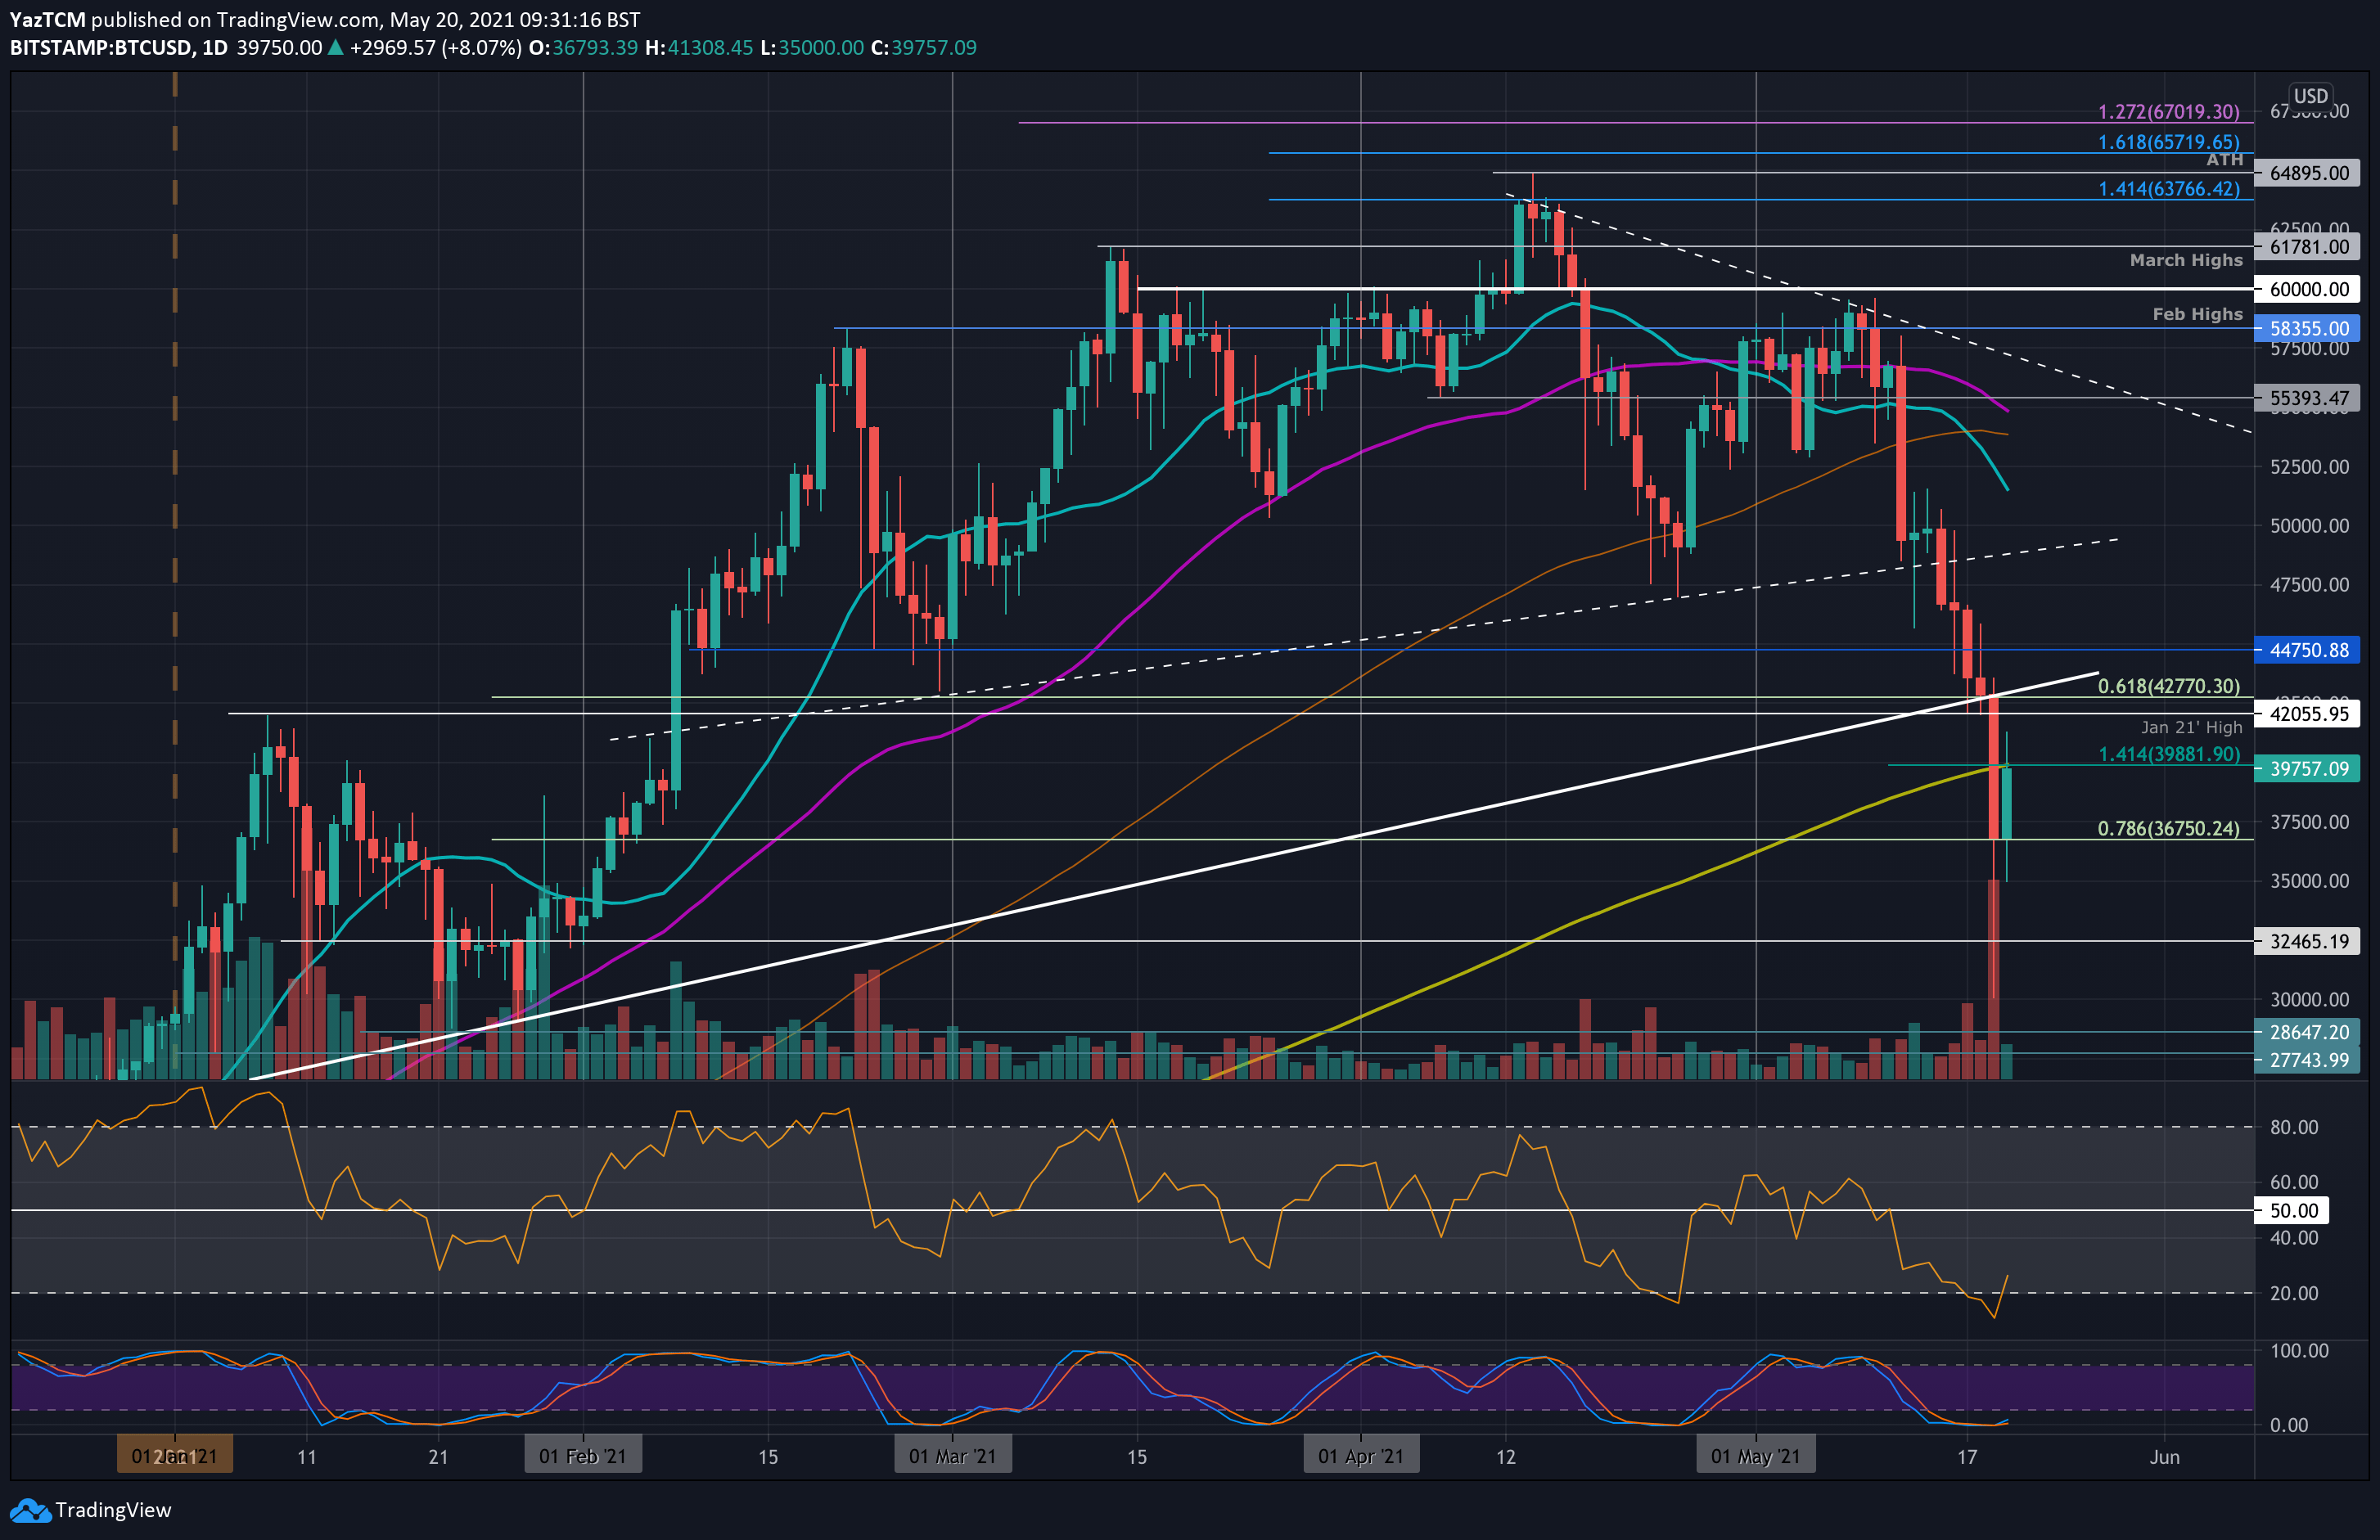
Yesterday, the cryptocurrency crashed by 30% from a high of $43,600 to reach as low as $30,060, according to Bitstamp. BTC started to rebound quickly, as can be seen by the huge wick on all following charts, and eventually closed the daily candle directly at the support of around $36,750, provided by a .786 Fib Retracement level. However, the daily close was below the critical 200-day moving average line, as mentioned in our previous analysis.
The MA-200: The Critical Level Tested As Resistance
Today, the decent bounce has allowed BTC to retest the same line, this time as resistance, around the $40,000 milestone. Like yesterday, this is the most significant level of resistance to watch for BTC. The price needs to break and close a daily candle above if BTC is set to recover in the coming weeks.
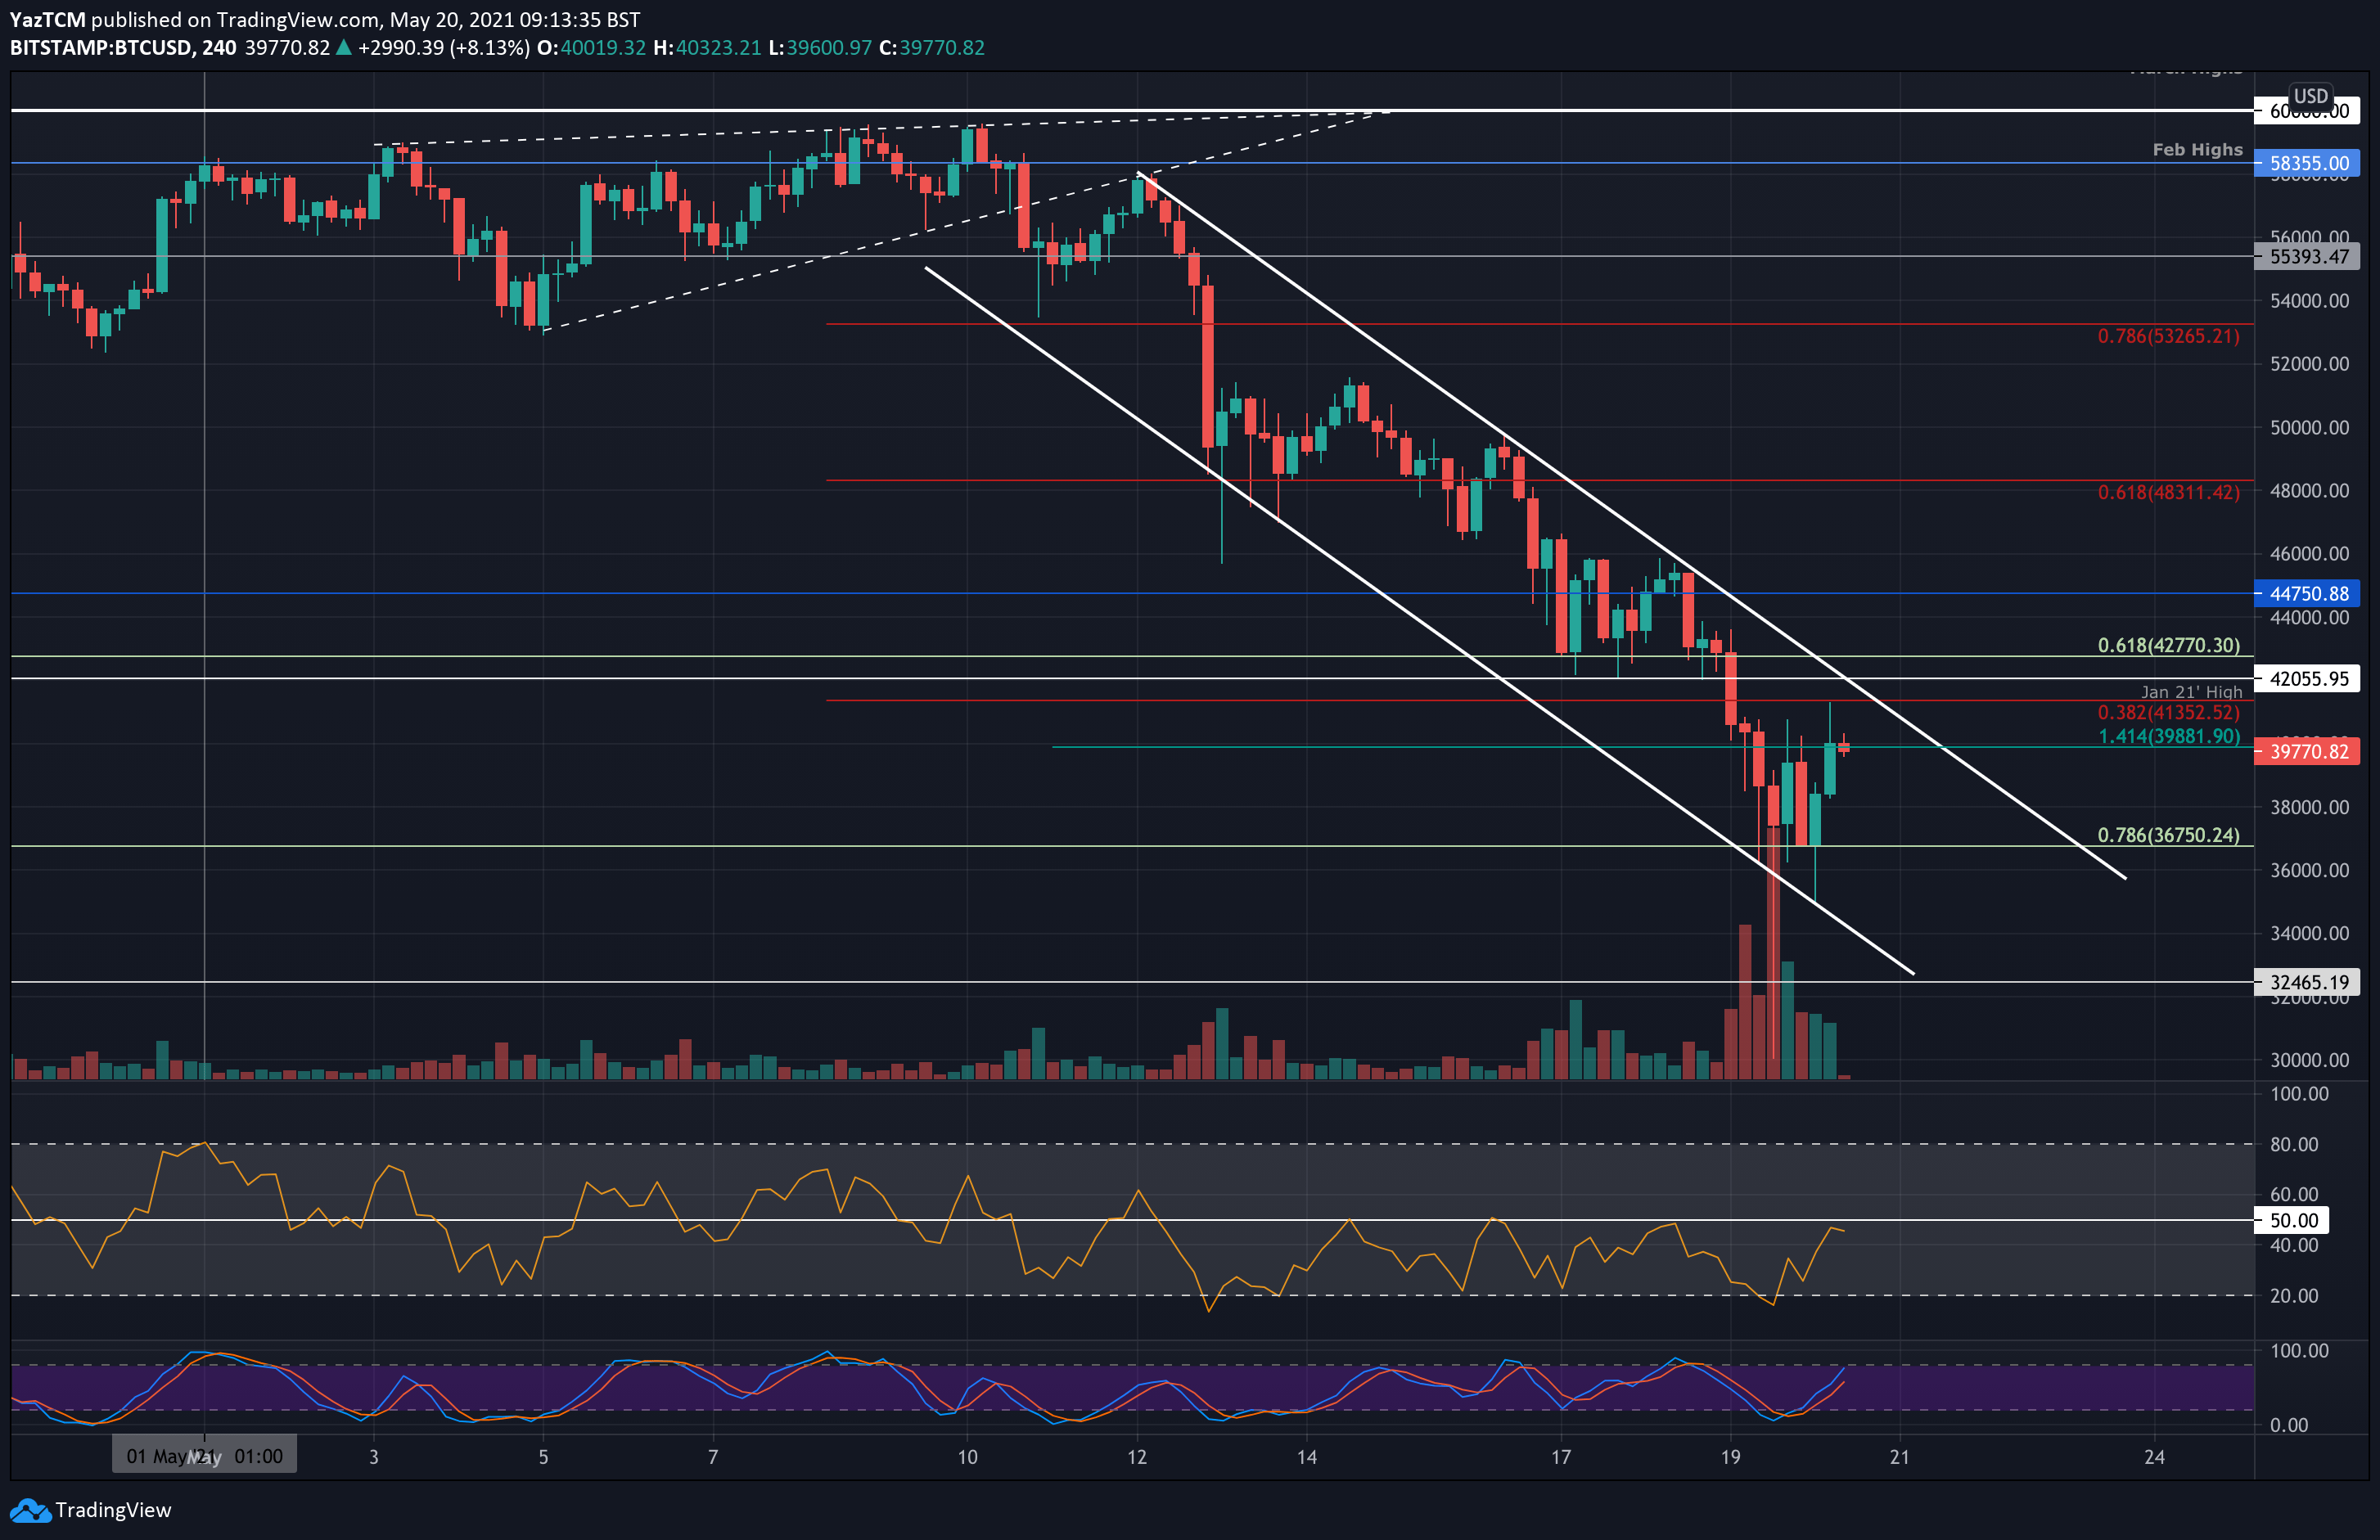
On the 4-hour chart, BTC is trading inside a descending price channel. The coin hit the lower boundary of the price channel numerous times yesterday and even crashed beneath it, with one candle falling as low as $30,000. Regardless of the spikes beneath the channel, bitcoin will need to break the upper boundary to provide the first signal of recovery.
Additionally, we can see that BTC spiked as high as $41,350 today. This will be the next major resistance (if MA-200 along with $40K is breached), which is provided by a bearish .382 Fib Retracement.
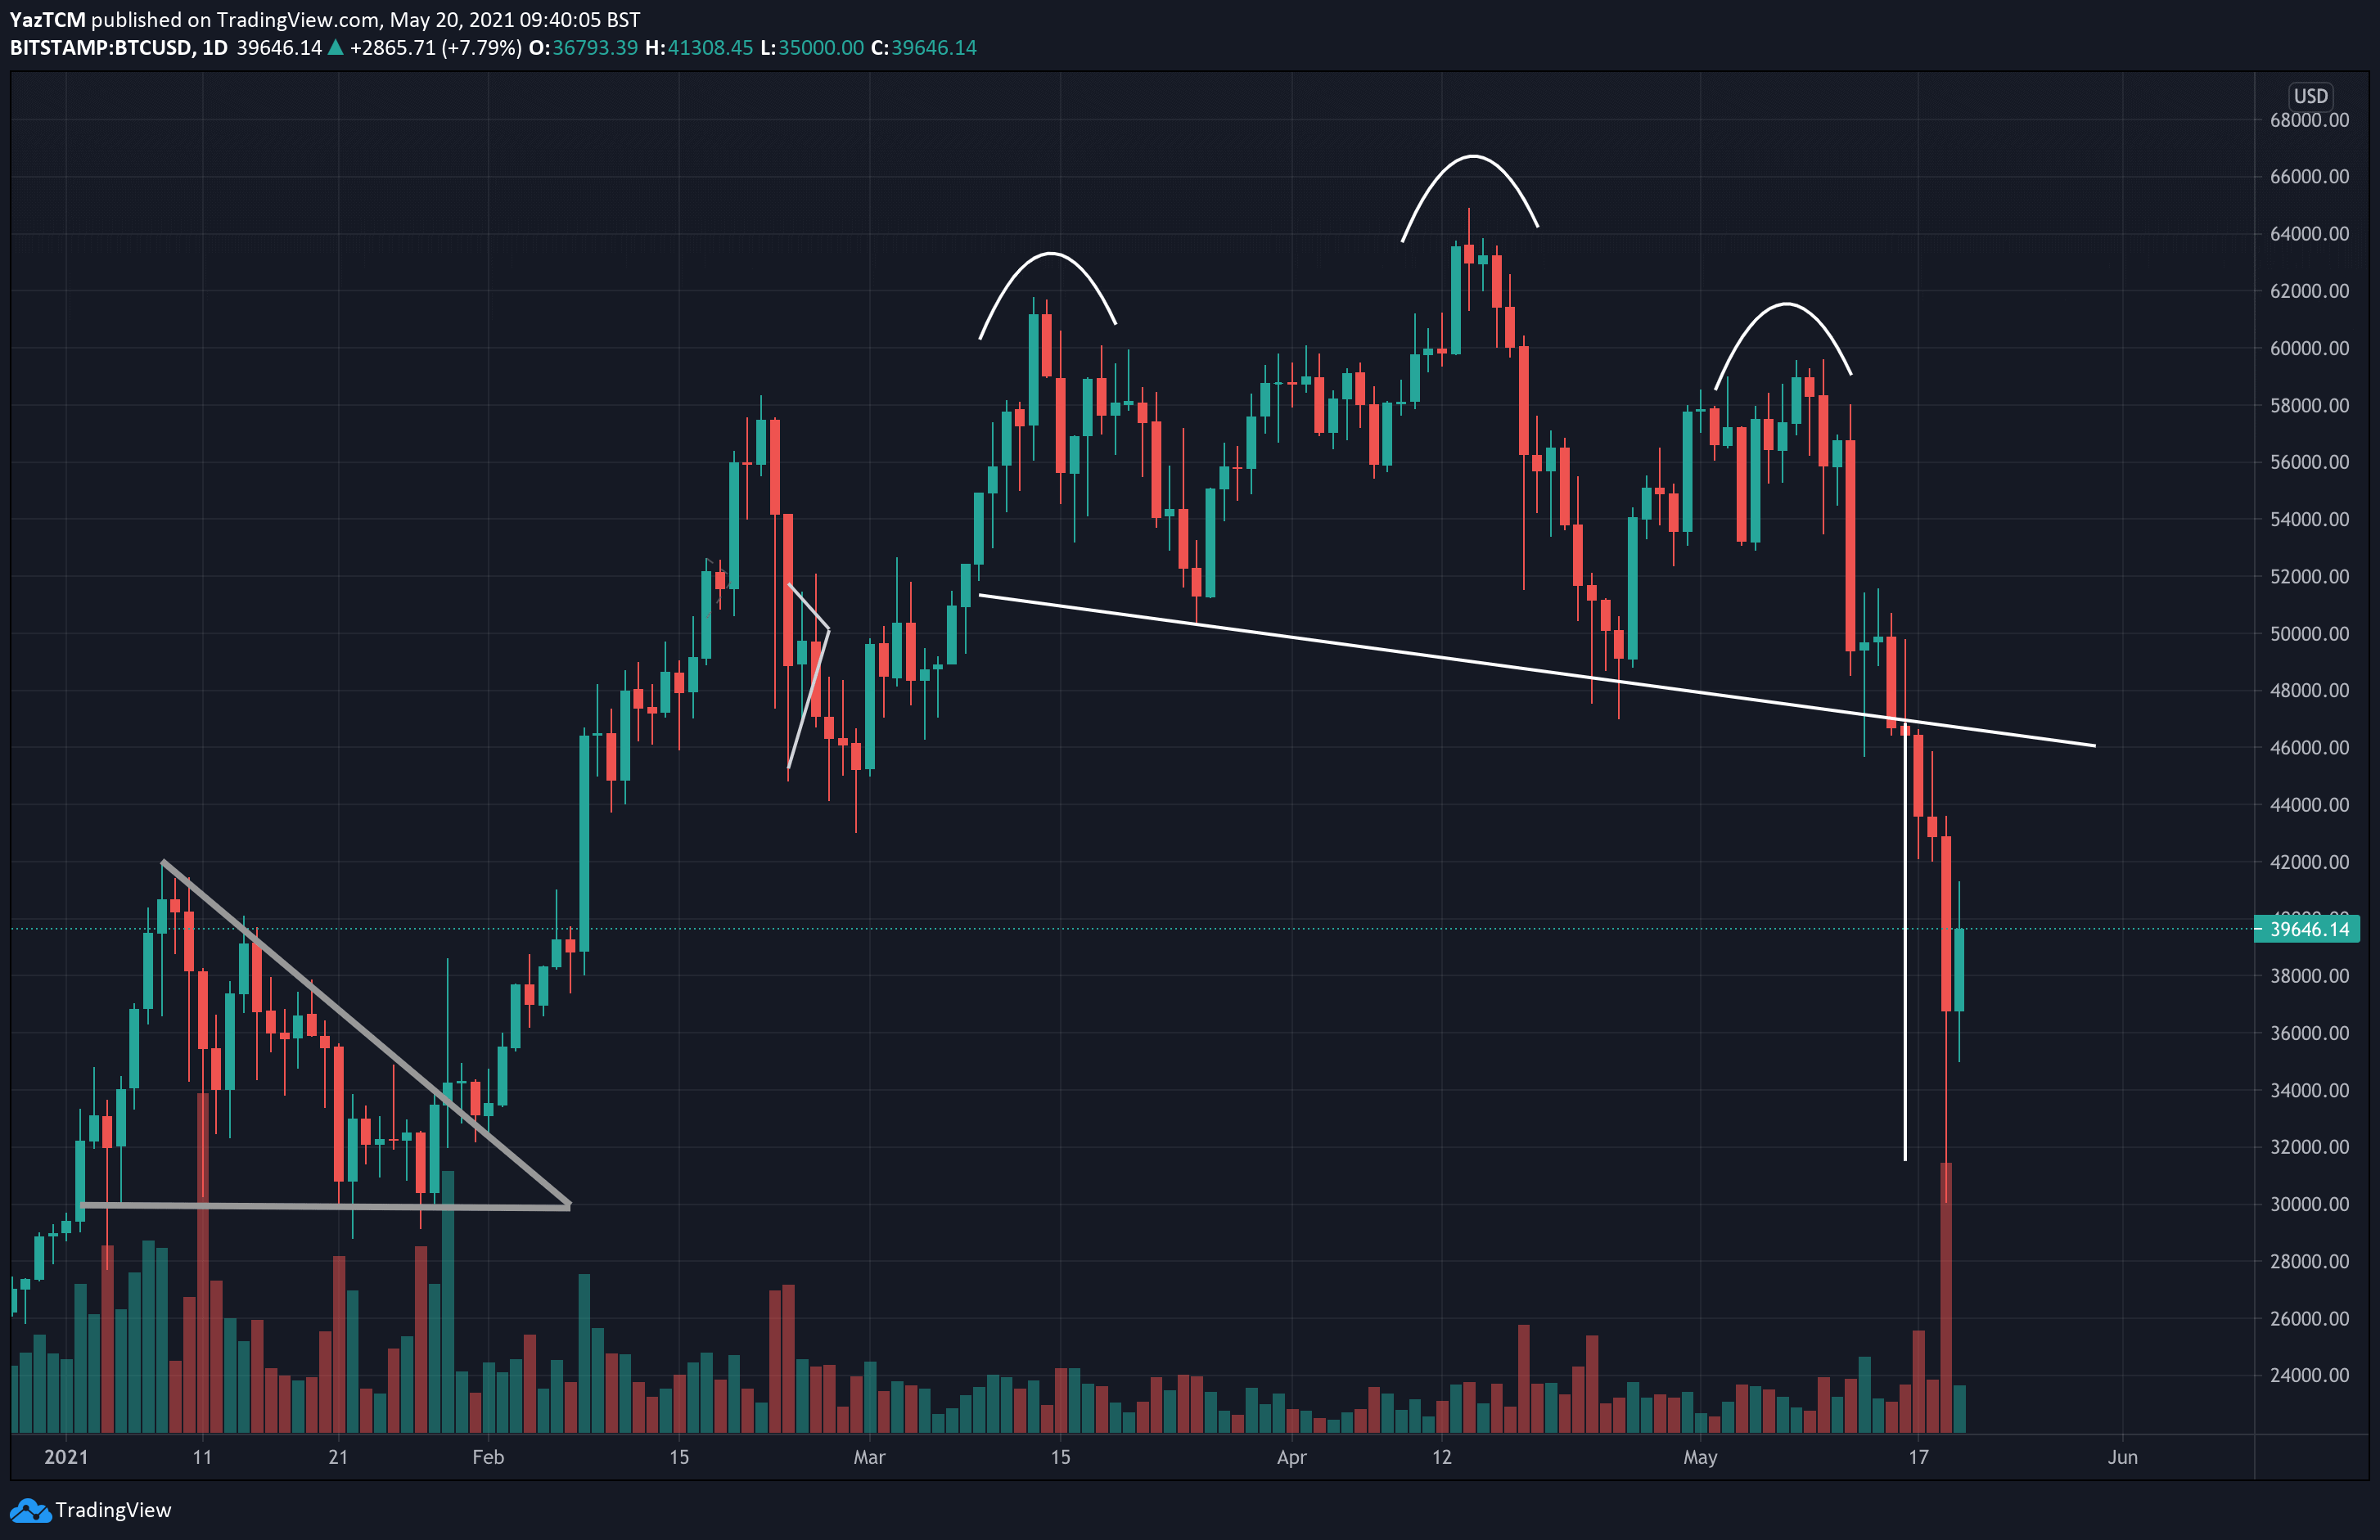
Lastly, it is worth noting that the spike to $30,000 yesterday allowed the bearish head & shoulders pattern to hit its target as the pattern has now completed. We were tracking this H&S pattern and called the target for the past two weeks.

BTC Price Support and Resistance Levels to Watch
Key Support Levels: $36,750, $35,000, $32,465, $30,000, $28,650.
Key Resistance Levels: $40,000, $41,350, $42,000, $42,770, $44,750.
Looking ahead, the first resistance lies at $40,000 (200-day MA). This is followed by $41,350 (bearish .382 Fib & upper boundary of falling price channel – today’s current high), $42,000 (Jan 2021 highs), $42,770 (previous .618 Fib), $44,750, and $48,310 (bearish .618 Fib).
On the other side, the first solid support lies at $36,750 (.786 Fib). This is followed by $35,000 (today’s low), $32,465, $30,000 (yesterday’s low), and $28,650.
The RSI was trading inside extremely oversold conditions yesterday as the market was the most oversold it had been since the March 2020 crash (the COVID19 black Thursday). Today, it has bounced back out of extremely oversold territory as the bearish pressure shows signs of easing up.
Bitstamp BTC/USD Daily Chart
Bitstamp BTC/USD 4-Hour Chart